

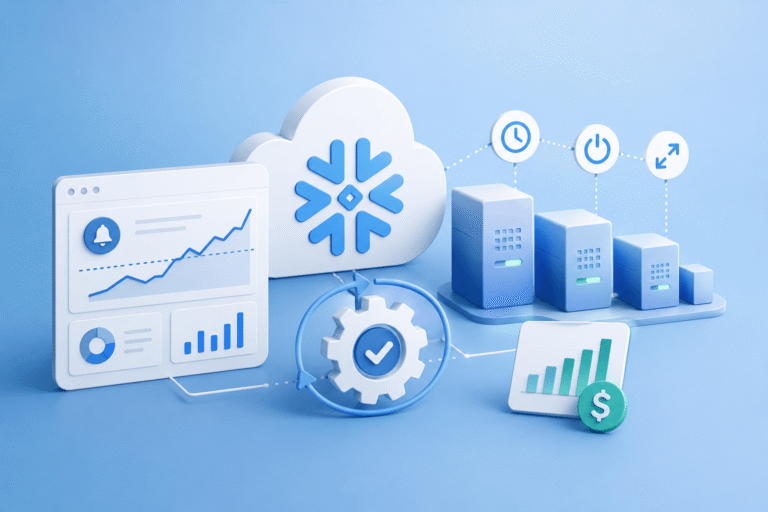
Short answer: you automate Snowflake budget control by pairing native spend alerts with a system that acts on warehouse inefficiency continuously right-sizing compute, suspending idle warehouses, and scaling clusters up or down in real time instead of waiting for a human to read a dashboard and make a change. Teams that do this typically report cost reductions in the 30%-50% range within one to two billing cycles, without touching application code.
If you’re a data engineering lead who just got handed “lower our Snowflake bill” as a task, this post covers why that bill keeps growing, where Snowflake’s built-in tools stop helping, and what an automated layer needs to do to actually hold the line.
Why Does Snowflake Spend Keep Exceeding Budget?
Snowflake’s consumption model means cost grows quietly, in small decisions made every day by people who aren’t thinking about the bill. A few patterns show up in almost every account audit:
- Overprovisioned warehouses. Teams provision a Large or X-Large warehouse to protect performance during peak load, then never revisit it. A Medium warehouse can cost roughly 4x an X-Small for equivalent work, and most queries running on it never needed that much horsepower.
- Auto-suspend tuned wrong in both directions. Suspend too slowly and you pay for idle compute. Suspend too aggressively and the warehouse loses its cache, so the next query has to pull from cold storage- which can cost more than the idle time it was meant to save.
- Serverless features left running. Materialized views, Snowpipe, and other serverless services don’t auto-suspend the way warehouses do. Once enabled, they accrue credits continuously, and nobody is watching them the way they watch a warehouse.
- Storage creep. Storage typically makes up 20-30% of a Snowflake bill, and it rarely gets the same scrutiny as compute because it doesn’t spike the way a runaway query does.
- Query patterns that scan more than they need to. Select*, unnecessary nested subqueries, and joins without the right clustering keys all inflate the compute time a query needs, which inflates the bill for every run of that query going forward.
None of these show up as a single dramatic event. They accumulate, which is exactly why a monthly spend review usually catches the problem two or three billing cycles too late.
What Can Snowflake’s Native Tools Actually Do About It?
Snowflake ships real cost controls, budgets, resource monitors, and anomaly alerts, and they’re worth turning on regardless of anything else you do. Budgets let you set monthly spend thresholds per workload and get notified when actual or projected spend crosses them, with guardrails that can suspend warehouses once a hard limit is hit.
The limitation isn’t that these tools are weak; it’s that they’re fundamentally notification systems, not optimization systems. A Budget tells you that you’re about to overspend. It doesn’t right-size the warehouse that’s causing it, tune the auto-suspend setting, or figure out which of forty warehouses is the actual culprit. Someone still has to read the alert, investigate, and make a change, and on most data teams, that someone is already busy shipping something else.
That gap between “we got an alert” and “we fixed the thing” is where budgets quietly slip even at teams who are doing everything Snowflake recommends.
What Does an Automated Budget Control Solution Actually Do?
An automated layer closes that gap by acting on the same signals a human would use, continuously and without waiting for a monthly review. In practice, the category of tools built for this, including Seemore Data, Keebo, select.dev, and a handful of others, converges on the same core capabilities:
- Continuous warehouse right-sizing. Instead of a one-time sizing exercise, the system re-evaluates warehouse size hour by hour based on actual query load, and resizes automatically when workload patterns shift.
- Automated suspend/shutdown tuning. Idle warehouses get suspended based on real usage patterns rather than a single static timeout, balancing idle-cost savings against cache-loss cost.
- Auto-scaling of clusters. Multi-cluster warehouses scale cluster count up during genuine concurrency spikes and back down immediately after, instead of staying scaled up “just in case.”
- Anomaly detection with root cause. Rather than just flagging that spend jumped, the system identifies which warehouse, query, or workload caused it — so the alert comes with an answer, not just a number.
- Budget enforcement tied to action, not just notification. Thresholds trigger an optimization response (resize, suspend, throttle) rather than only an email.
The practical difference for a team lead: instead of assigning an engineer to “go look at the Snowflake bill” every month, the system is making the same class of decision every hour, at a scale no team could staff for manually.
What Results Do Teams Actually See?
Numbers here vary by workload, but the pattern is consistent across public case studies: SurveyMonkey cut monthly compute spend by 28% without adding an engineer, and Artlist reached a 30% reduction within 30 days of turning automation on. DoubleVerify’s result is worth calling out specifically for team leads: their Director of Engineering put the real win in terms of headcount, not just credits — “the saving to me wasn’t just the Snowflake credits, it was not having to assign a resource” — which is usually the actual constraint behind a “lower the bill” mandate, not a lack of ideas.
The common thread isn’t a specific percentage. It’s that none of these teams solved the problem by hiring; they solved it by automating the decisions a person would otherwise have to keep making, forever.
How to Get Started This Week
You don’t need to commit to a platform before you know where your money is going. A reasonable sequence:
- Turn on Snowflake’s native Budgets and Resource Monitors first. They’re free, fast to configure, and give you a floor of protection while you evaluate anything else.
- Pull a warehouse-by-warehouse cost and utilization report. Look specifically for warehouses running at low utilization relative to their size, and serverless features that have been on for months with no review.
- Fix the obvious oversizing and auto-suspend settings by hand. This alone typically recovers some savings and tells you how much manual effort recurring optimization would take at your current warehouse count.
- Pilot an automated layer on a subset of warehouses. Measure before/after on the same weekday pairs (compare this Tuesday to the last three Tuesdays, not to yesterday) to avoid mistaking normal workload swings for savings.
- Decide based on the pilot, not the pitch. If the automation is doing real work, you’ll see it in cost-per-query, not just in a lower total that could just as easily be lower usage.
FAQ
Is Snowflake’s own Budgets feature enough to control costs? It’s a necessary first layer but not sufficient on its own. Budgets alert you when spend crosses a threshold; they don’t diagnose which warehouse or workload caused it or make the fix. Most teams use Budgets as a safety net alongside an automation layer that acts on the underlying cause.
How much can automation actually save on a Snowflake bill? Publicly reported results from Seemore Data customers range from roughly 28% to over 70%, depending on how oversized the starting configuration was. Accounts with heavily over-provisioned warehouses or loose auto-suspend settings tend to see the larger end of that range.
Does automating warehouse sizing put query performance at risk? Automated right-sizing tools are designed to resize based on observed query performance, not just cost, and typically include guardrails that prevent a resize from breaching latency requirements. That said, any team evaluating one should pilot it on non-critical warehouses first and watch query duration, not just cost, before rolling it out account-wide.
How long does it take to see savings after turning on automation? Case studies commonly show measurable savings within 30 days, since warehouse-level optimizations (sizing, suspend timing, scaling) take effect on the next few hours of query traffic rather than requiring a data model change.
Do I need to change my data models or queries to benefit? No- the automation described here operates at the warehouse and cluster level, not the query or schema level, so it doesn’t require rewriting SQL or restructuring tables. Query-level optimization is a separate, complementary lever if you want to go further.
