
When a human runs a query, there’s an instinct. You see the warehouse size, you estimate the scan, and you hit cancel if something looks wrong. The Snowflake cost increase usually starts long before anyone notices – and with agentic workloads, it moves faster than ever.
When an AI agent runs 200 queries in parallel at 2 am, nobody’s watching.
That’s the core problem with agentic AI on your data stack. These systems are designed to be autonomous – to spin up workloads, investigate data, and iterate without human intervention. That’s exactly what makes them valuable. It’s also exactly what makes them a FinOps nightmare.
A single runaway agent loop can burn through thousands of dollars in compute costs in minutes. And unlike a human who eventually logs off, an agent doesn’t get tired, doesn’t notice the bill, and doesn’t stop unless something stops it.
This article covers where the cost exposure actually comes from, why your current monitoring won’t catch it, and what agentic AI cost control looks like in practice.

TL;DR
- AI agents query your data warehouse autonomously, with no built-in cost intuition
- A runaway agent loop can generate a four-figure compute bill in minutes
- Snowflake Cortex AI, Databricks agent frameworks, and orchestration tools all create new cost exposure points
- Existing monitoring tools flag errors – not expensive, but successful agent runs
- The fix isn’t disabling agents – it’s adding a cost intelligence layer underneath them
- Seemore monitors agentic workloads the same way it monitors pipelines: continuously, at the query level, against a baseline

The New Cost Exposure: What AI Agents Actually Do to Your Warehouse
Before getting into the specific risks, it helps to understand the mechanics.
Traditional data workloads are predictable. A dbt job runs on a schedule, scans a known set of tables, and produces a known output. You can benchmark it. You can set a budget for it. You can flag it if it suddenly costs 3x more than usual.
Agentic workloads are different in four ways:
- They’re dynamic. An agent decides what to query based on context, not a fixed script. The same agent task can generate 5 queries or 500, depending on what it finds along the way.
- Parallelization is aggressive. Most agent frameworks fan out – spawning multiple sub-agents or parallel queries to investigate different hypotheses simultaneously. On a large Snowflake warehouse, this is extremely expensive.
- They retry on failure. Agents are built to be resilient. If a query fails or returns unexpected results, the agent attempts to retry it, often with a broader scope. Each retry is another compute charge.
- Unattended by design. Agent tasks are triggered by events, schedules, or upstream systems – not by a human sitting at a keyboard. There’s no one to notice when costs spike at 3 am.
Put these four together, and you have a workload type that your current cost controls weren’t designed for.
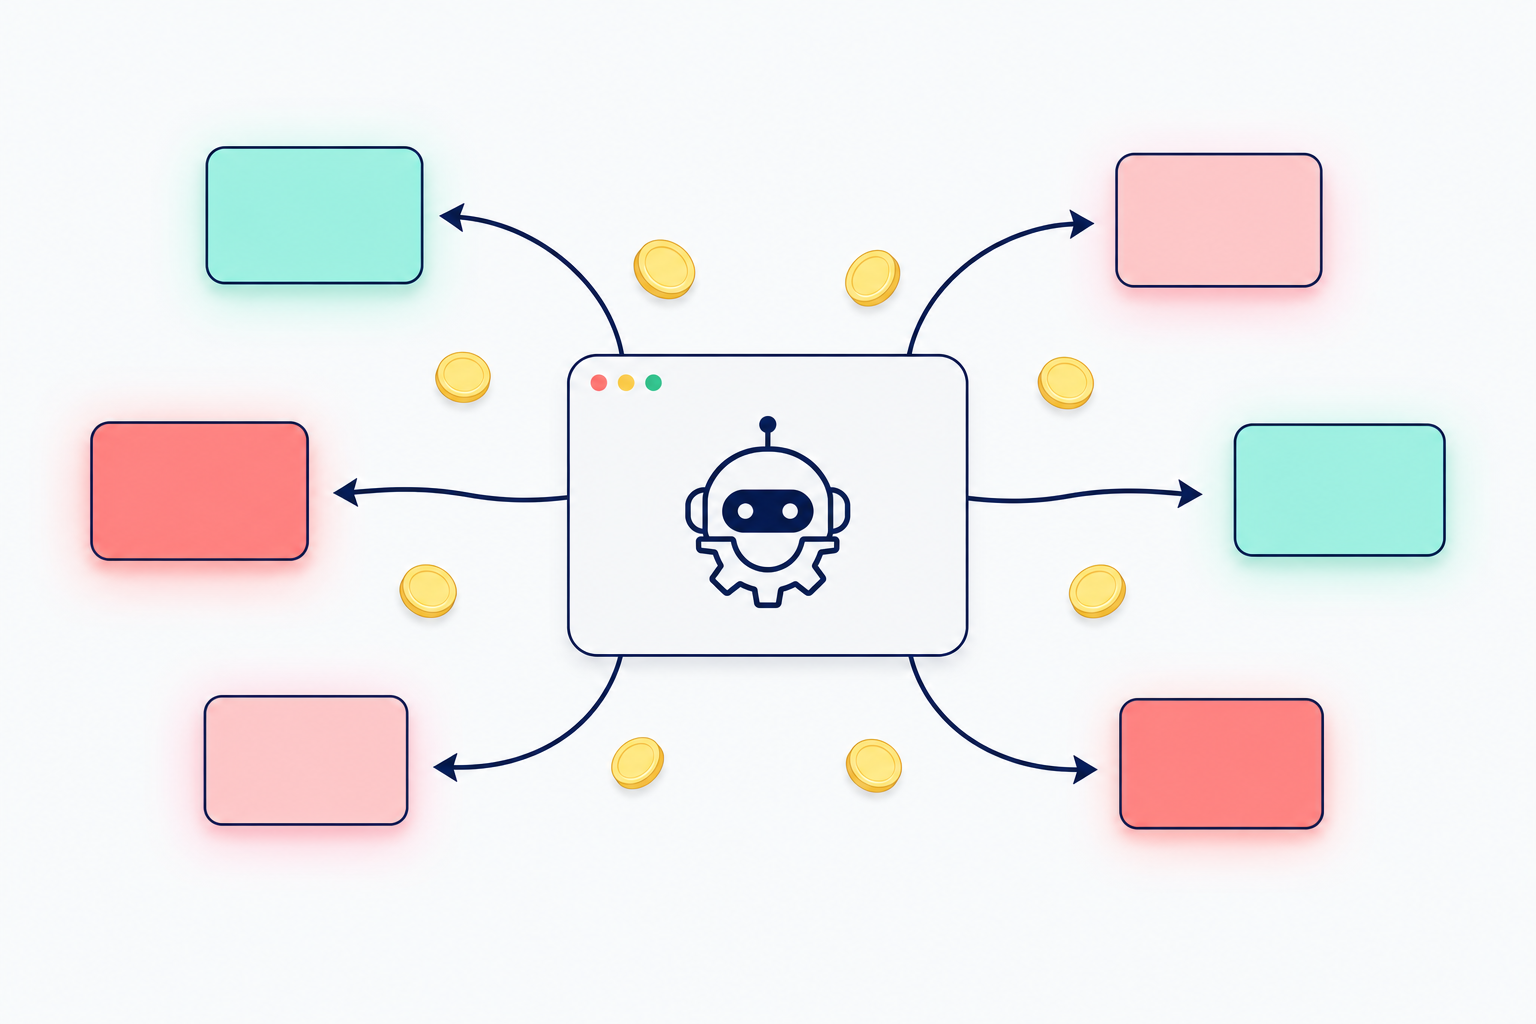
Cost Exposure by Agent Type
| Agent Type | Typical Workload | Worst-Case Query Pattern | Estimated Cost Without Guardrails | Detection Gap |
|---|---|---|---|---|
| Incident investigation agent | Queries logs and metrics tables to find the root cause | Fan-out: 100+ parallel queries on XL warehouse | $500–$2,000 per incident run | Monitoring shows queries succeeded – no cost alert |
| Data quality agent | Scans tables for anomalies and schema drift | Full table scans across multiple large tables | $200–$800 per run | Pipeline monitoring shows no errors |
| Snowflake Cortex AI agent | Uses Cortex AI functions on large datasets | Token-intensive Cortex calls on wide tables | Variable – Cortex AI pricing is token-based, scales with data volume | No native cost cap on Cortex AI function calls |
| ML feature engineering agent | Builds and tests feature combinations iteratively | Repeated joins and aggregations across fact tables | $300–$1,500 per experiment cycle | Job scheduler shows successful completion |
| Orchestration agent (LangGraph, CrewAI) | Coordinates multiple sub-agents across data sources | Cascading sub-agent spawning, each hitting the warehouse | $100–$5,000+ depending on depth | Orchestrator logs show success, warehouse logs show cost spike |
Risk 1: The Fan-Out Query Blast
What happens
A single-agent task spawns multiple parallel sub-queries, each investigating a different dimension of the same problem. This is intentional agent design. The problem is that each sub-query hits your warehouse independently, and your warehouse treats them as concurrent workloads.
On an auto-scaling warehouse, Snowflake responds by spinning up additional compute clusters. The agent gets fast results. You get a credit spike that looks like a usage anomaly with no single expensive query to point to.
Why does monitoring miss it
Traditional monitoring looks at individual query cost and pipeline success. Fan-out events appear as many small, successful queries – none individually alarming, but collectively expensive. Without aggregation by agent task or session, the pattern is invisible.
What to implement
Set a maximum concurrency limit on agent-facing warehouses. Create dedicated warehouses for agentic workloads so their cost is isolated and attributable. Set warehouse credit quotas that trigger suspension before costs compound.
Risk 2: Snowflake Cortex AI Cost Accumulation
What happens
Snowflake Cortex AI brings LLM capabilities directly into your warehouse – functions like COMPLETE, CLASSIFY_TEXT, EXTRACT_ANSWER, and SENTIMENT run natively on Snowflake compute. For agents that use Cortex AI to analyze, summarize, or classify data at scale, costs accumulate on two axes: the Snowflake credits consumed by the query execution, and the token-based Cortex AI pricing applied to each function call.
When an agent iterates – running Cortex AI functions repeatedly on large datasets as part of an investigation loop – Snowflake Cortex pricing compounds quickly. A single run that calls CORTEX.COMPLETE across a 10 million row table can cost significantly more than the same query without Cortex functions.
Why does monitoring miss it?
Cortex AI costs appear in your Snowflake bill as compute credits, not as a separate line item that maps clearly to an agent task. Without query-level tagging and cost attribution, a Cortex AI cost spike looks identical to any other large query execution.
What to implement
Tag every Cortex AI query with the agent task that triggered it. Set row-level limits on Cortex function calls within agent loops. Monitor Cortex AI credit consumption separately from standard compute credits – they compound differently and need separate baselines.
Risk 3: The Retry Loop
What happens
Agents are resilient by design. When a query returns unexpected results – too few rows, a schema mismatch, a timeout – the agent retries, often with a modified query that’s broader in scope. Each retry is a fresh compute charge. In a poorly configured agent, a single task that hits edge cases can generate dozens of retries before either succeeding or failing loudly.
Why does monitoring miss it?
Retry loops look like normal query activity unless you’re tracking query count by session and correlating with execution cost. Each retry is a legitimate query. The pattern of escalating retries against the same tables is what signals a problem – and that pattern requires session-level cost aggregation to see.
What to implement
Set maximum retry limits at the agent framework level (LangGraph, CrewAI, and AutoGen all support this). Add a total-cost-per-task budget that triggers task termination if exceeded. Log agent task IDs as query tags so retry sequences can be traced end-to-end. The pattern of escalating retries against the same tables is what signals a problem – and as Galileo’s research on AI agent cost optimization shows, this pattern requires session-level cost aggregation to surface reliably.
Risk 4: Unattended Overnight Runs
What happens
Agent tasks triggered by event-based orchestration or nightly schedules run during off-hours when nobody is watching dashboards. A task that behaves normally in testing – where it runs on a small dataset – can behave very differently in production against full-scale data at 2 am.
The compute runs until it finishes, times out (Snowflake’s default query timeout is 48 hours), or hits a warehouse credit quota that nobody set. By morning, the bill has already been incurred.
Why does monitoring miss it?
Alerting systems are typically configured for business hours or for explicit error states. A query that runs for 6 hours and succeeds doesn’t trigger an error alert. It triggers a line item on your monthly bill.
What to implement
Set aggressive query timeouts on agent-facing warehouses – 30 to 60 minutes maximum, not Snowflake’s 48-hour default. Configure credit quota alerts that fire in real time, not at billing review. Ensure at least one human is paged when the agent task compute exceeds a defined threshold, regardless of time of day.
The Monitoring Gap: Why Your Current Stack Is Blind to Agent Costs
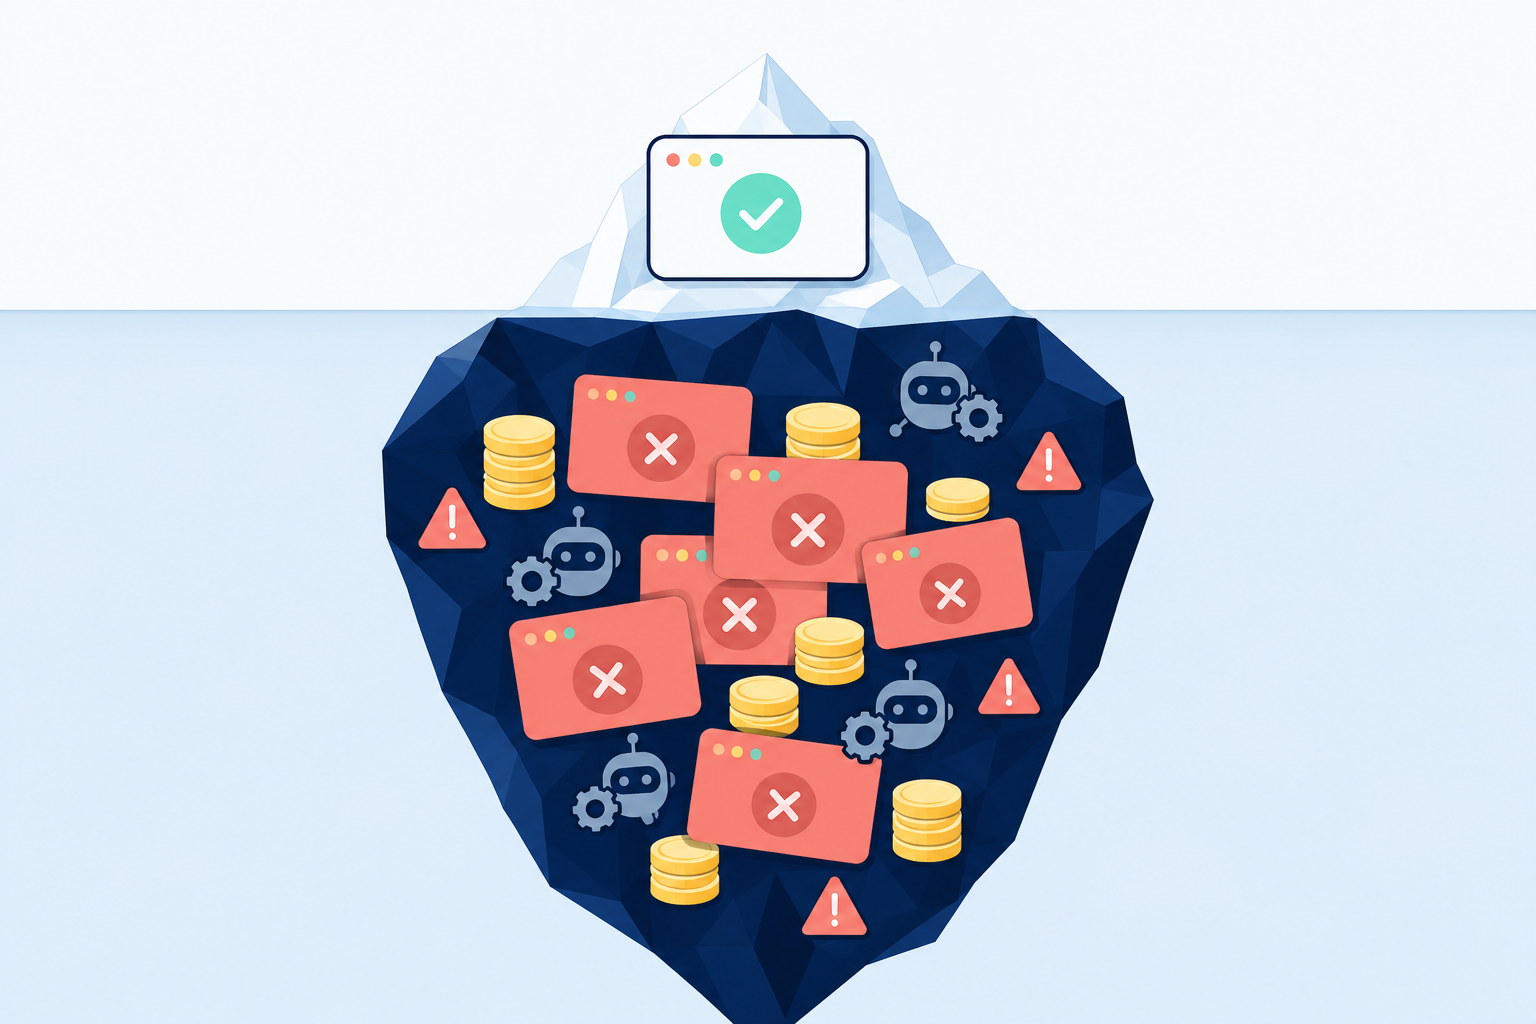
Standard pipeline monitoring tools – Monte Carlo, Databand, Great Expectations – were built to answer one question: did the data arrive correctly?
They watch for schema drift, row count anomalies, freshness failures, and data quality issues. They’re excellent at what they do. But they have no concept of compute cost per agent task, credit consumption per Cortex AI function call, or cost-per-run trending for an agentic workload.
The result is a monitoring stack that gives you a green status board while a runaway agent quietly burns through your monthly credit budget in a single weekend.
This isn’t a criticism of those tools – it’s a scope problem. They weren’t designed for agentic workloads. Neither was your FinOps platform, which operates at the warehouse level and can’t tell you which agent task caused a credit spike.
Seemore closes this gap. It monitors at the query level, attributes cost to the workload that generated it – whether that’s a dbt job, a Cortex AI function call, or an agent task – and alerts when a pattern starts costing more than its baseline. The same cost intelligence that surfaces a misconfigured auto-suspend setting on Monday morning surfaces a runaway agent loop at 3 am on Sunday.
You don’t need to choose between agentic AI and cost control. You need a cost layer that understands both.
Frequently asked questions
How much do AI agents cost to run on a data warehouse?
It depends heavily on the agent type and workload. A single incident investigation agent running on a Snowflake XL warehouse with aggressive fan-out can consume $500–$2,000 in credits per run. Agents using Snowflake Cortex AI functions add token-based costs on top of standard compute credits. Snowflake Cortex pricing scales with data volume and function call count, making iterative agent loops particularly expensive. Without query-level cost monitoring, these costs are invisible until billing review.
What is Snowflake Cortex AI, and how does it affect compute costs?
Snowflake Cortex AI is a suite of LLM-powered functions – including COMPLETE, CLASSIFY_TEXT, EXTRACT_ANSWER, and SENTIMENT – that run natively inside Snowflake. Cortex AI pricing is based on token consumption and the specific Cortex model used, in addition to standard Snowflake compute credits. When AI agents call Cortex AI functions iteratively across large datasets, costs compound on both dimensions simultaneously. Teams evaluating Snowflake Cortex pricing should account for agent-driven usage patterns, not just single-query benchmarks.
How do I prevent runaway AI agent costs in Snowflake or Databricks?
Four controls matter most: set query timeouts on agent-facing warehouses (30–60 minutes, not Snowflake’s 48-hour default), enforce credit quota alerts that fire in real time, tag every agent query with a task ID for attribution, and set maximum concurrency limits on agent warehouses to prevent fan-out from triggering auto-scaling. Add a cost-per-task budget at the orchestration layer as a final circuit breaker.
What is AI agent observability, and why does it matter for FinOps?
AI agent observability means tracking not just whether an agent task succeeded, but what it cost to run, how many queries it generated, and how that cost compares to previous runs. For FinOps teams, this is the missing layer – existing tools monitor errors and data quality, but not compute cost per agent task. Without it, agentic AI workloads are a blind spot in your cost model, growing silently until they appear as billing anomalies.