6 Best Snowflake Cost Management Tools (2026 Comparison)

Snowflake’s pricing model charges for compute, storage, and cloud services separately, making Snowflake cost control more complex than most teams anticipate. Virtual warehouses spin up fast, queries run across massive datasets, and cloud services layer charges accumulate quietly in the background. Without the right tooling, engineers end up spending hours firefighting anomalies that proper observability would have surfaced in minutes.
This guide covers the best Snowflake cost management tools available in 2026, with a feature-by-feature breakdown to help CDOs, lead data engineers, and FinOps practitioners find the right fit. Each platform is evaluated on primary focus, automation capabilities, root cause analysis depth, and pricing.
How do Snowflake tools for cost optimization reduce compute spend?
Snowflake cost optimization tools reduce compute spend by identifying inefficiencies and enabling teams to take corrective action across warehouses, pipelines, and downstream usage, including:
- Identifying expensive or frequently executed queries
- Detecting underutilized or oversized virtual warehouses
- Highlighting unused tables, pipelines, and dashboards
- Exposing cost and usage anomalies across teams and workloads
- Prioritizing optimization efforts based on real usage impact
More advanced platforms extend beyond observability by automating recommendations, detecting anomalies in real time, and using AI-driven insights to connect cost, performance, and data lineage across the entire data stack.
Quick Verdict
Best overall for autonomous cost reduction: Seemore Data. Seemore combines end-to-end lineage, automated warehouse management, and AI-powered root cause analysis to reduce Snowflake spend by up to 40%.
Best for general cloud cost grouping and multi-cloud visibility: Finout. Strong for teams managing Snowflake alongside AWS, GCP, or Azure who need unified cost attribution in a single dashboard.
Snowflake Cost Management Tools: Feature Comparison Matrix
How do the features of the top Snowflake cost management tools compare? The table below maps all six platforms across the dimensions that matter most for FinOps and data engineering teams. Jump to any section for the full review.
| Tool | Primary Focus | Auto-Scaling / Auto-Suspend | Root Cause Analysis (Lineage) | Pricing Model |
|---|---|---|---|---|
| Seemore Data | Autonomous full-stack optimization | Yes – dynamic resizing, Gen2 migration, active auto-shutdown | Full lineage: ingestion (Fivetran, dbt) through BI (Tableau, Looker) | Contact for pricing |
| Finout | Multi-cloud cost attribution and grouping | Limited (via Snowflake native integration) | No | Usage-based / Contact for pricing |
| Chaos Genius | Anomaly detection and cost observability | No | Partial (ETL-level) | Open source / Paid tiers |
| Metaplane | Data quality observability with cost insights | No | Partial (pipeline lineage) | Contact for pricing |
| SELECT.dev | Query optimization and performance tuning | No | No | Subscription / Contact for pricing |
| Snowflake Native | Built-in cost monitoring and resource controls | Yes (auto-suspend/resume) | No | Included with Snowflake |
Best Snowflake Cost Management Tools: In-Depth Reviews
1. Seemore Data
Overview
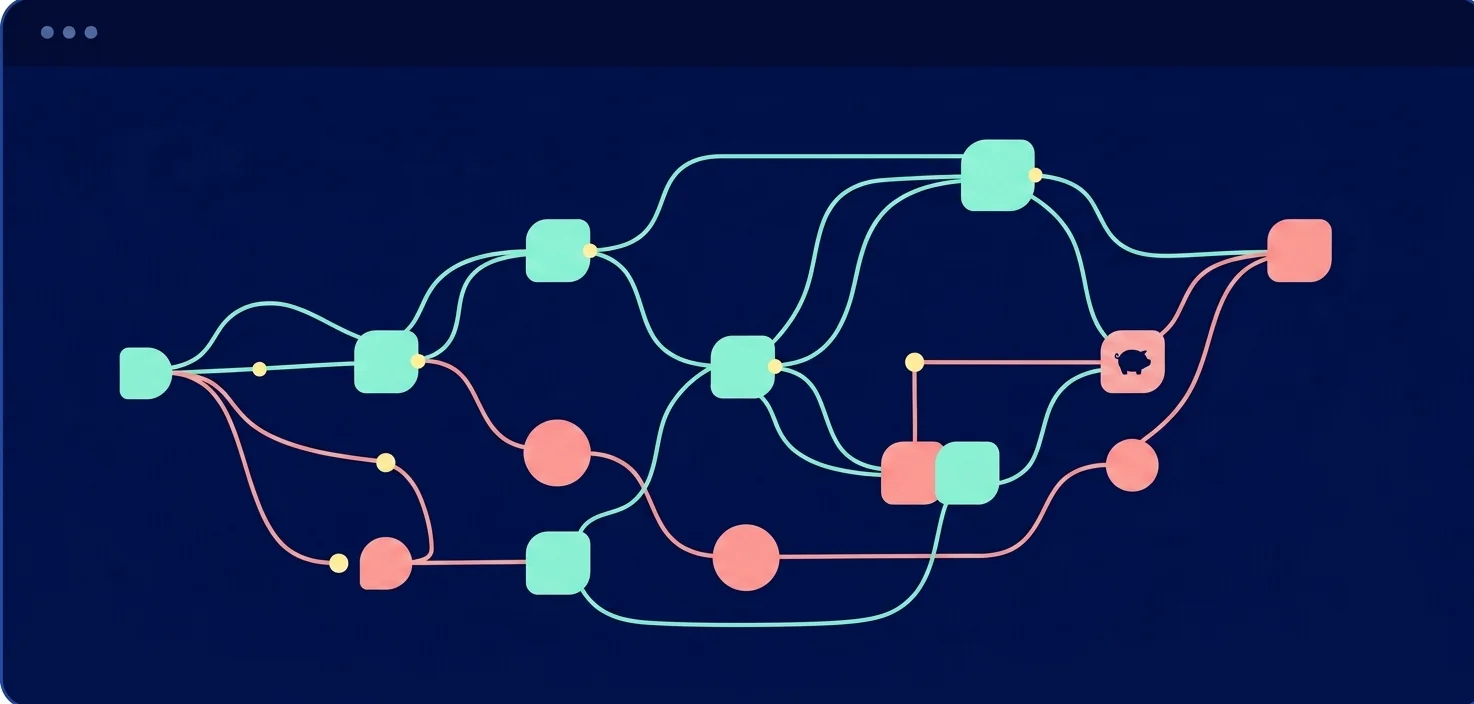
Seemore Data is an autonomous context-aware data engineering platform that continuously analyzes and optimizes cost, performance, and usage across the modern data cloud. It connects Snowflake spend to upstream tools like Fivetran and dbt, and downstream BI like Tableau and Looker, providing full-stack visibility and automated action in a single platform.
Standout Features
- End-to-End Context: Links every Snowflake cost to the dashboard triggering the query, the pipeline feeding it, and the team responsible. No other tool on this list maps cost to lineage at this depth.
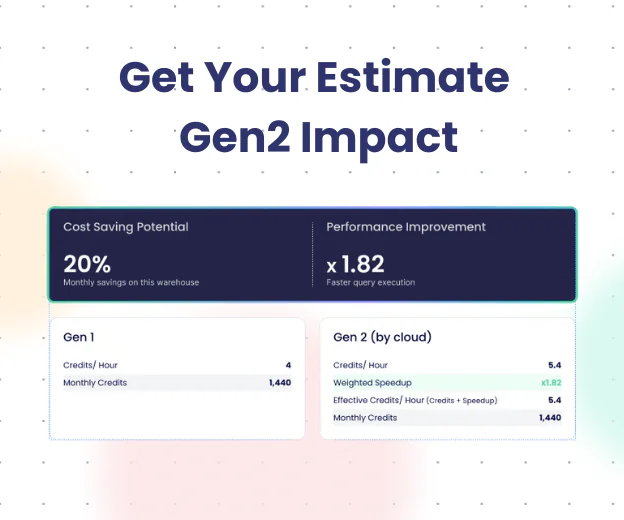
- Smart Pulse: Dynamically resizes virtual warehouses hourly based on real usage patterns and transitions workloads to Gen2 automatically.
- Auto-Shutdown: Suspends idle compute beyond Snowflake’s native auto-suspend, eliminating waste at the minute level.
- AI-Powered Auto Clustering: Recommends optimal clustering keys based on real workload and query patterns, reducing full-table scans without manual tuning.
- Auto Scaler: Adjusts warehouse size and concurrency in real time to balance cost and performance.
- Anomaly Detection and AI Root Cause Analysis: When a spend spike occurs, the AI agent explains the cause immediately (for example, a dbt model frequency change), reducing investigation time from hours to seconds.
- Query Optimization: Delivers context-aware recommendations grounded in full lineage and real workload impact.
Pros
- Only platform combining full-stack lineage with autonomous warehouse management
- Up to 40% cost reduction reported by customers
- Covers Fivetran, dbt, Tableau, and Looker in a single context graph
- Significantly reduces engineering time spent on cost firefighting
Cons
- Pricing is not publicly listed; requires a demo or assessment call
- Full value is most apparent in complex, multi-tool data stacks; smaller or simpler environments may not need the full capability set
2. Finout
Overview
Finout is a multi-cloud cost management platform that consolidates and analyzes cloud spending across providers, including Snowflake. It is best suited for teams managing Snowflake alongside AWS, GCP, or Azure who need unified cost attribution without deep data-stack observability.
Standout Features
- Unified Cloud Cost Dashboard: Tracks Snowflake costs alongside other cloud services in a single view.
- Cost Attribution: Identifies which teams, projects, or queries are driving spend.
- Custom Budget Alerts: Configurable thresholds for unexpected cost spikes.
- Spending Visualizations: Intuitive graphs and breakdowns of cost trends over time.
Pros
- Strong multi-cloud coverage for organizations running more than just Snowflake
- Quick to set up and configure
- Intuitive interface with clear cost grouping and allocation
Cons
- Limited Snowflake-specific depth; no query-level or warehouse-level automation
- No lineage or root cause analysis for Snowflake cost spikes
- Better suited as a complementary tool than a standalone Snowflake optimization solution
3. Chaos Genius
Overview
Chaos Genius is an open-source tool offering automated anomaly detection and cost insights for Snowflake. It provides real-time visibility into cost spikes and usage inefficiencies, with a focus on alerting teams before problems escalate.
Standout Features
- Automated Anomaly Detection: Flags unusual spending patterns in Snowflake usage automatically.
- Detailed Cost Reports: Breakdowns of compute, storage, and cloud services costs.
- Query Optimization Insights: Identifies costly queries and provides improvement recommendations.
- Integrations: Compatible with other cloud data sources beyond Snowflake.
Pros
- The open-source tier is accessible for teams with limited tooling budgets
- Good anomaly detection speed and configurable alerting
- Useful for catching unexpected charges early
Cons
- No autonomous optimization or warehouse automation
- Lineage is limited to ETL-level; no BI connectivity
- Requires significant manual follow-up after alerts compared to fully automated platforms
4. Metaplane
Overview
Metaplane is a data observability platform focused on data quality and pipeline reliability, with cost monitoring as a secondary capability. It helps teams ensure data operations are trustworthy and efficient by monitoring pipeline performance and alerting on quality issues.
Standout Features
- Data Observability: Monitors data quality and pipeline performance across the stack.
- Cost Insights: Surfaces areas where compute and storage costs can be reduced.
- Automated Alerts: Flags data quality issues that may cause inefficient query patterns.
- Lineage Visibility: Maps data flows to help pinpoint expensive operations.
Pros
- Strong data quality monitoring alongside cost visibility
- Good for teams where data reliability and cost control are equally important
- Pipeline lineage helps contextualize certain cost issues
Cons
- Cost management is secondary to data quality; Snowflake-specific cost features are limited
- No warehouse automation or autonomous actions
- Less suited for teams whose primary goal is Snowflake spend reduction
5. SELECT.dev
Overview
SELECT.dev offers a comprehensive suite of tools for optimizing Snowflake queries and enhancing performance. When teams choose to select Snowflake optimization platforms, SELECT.dev stands out for its hands-on, engineer-friendly recommendations that can be implemented without extensive setup.
Standout Features
- Query Optimization: Detailed, actionable guidance for improving query performance and reducing compute costs.
- Cost Insights: Identifies inefficient queries and underutilized virtual warehouses.
- File Sizing Recommendations: Optimizes file sizes for Snowpipe and batch ingestion to minimize overhead costs.
- Snowpipe Monitoring: Tracks Snowpipe costs and performance for continuous data ingestion pipelines.
Pros
- Practical, immediately actionable query-level recommendations
- Good fit for data engineering teams focused on targeted query tuning
- Strong Snowpipe-specific monitoring
Cons
- Scope is limited to query and warehouse optimization; no full-stack lineage
- All recommendations require manual implementation; no autonomous actions
- Does not cover the BI layer or upstream ingestion tools
6. Snowflake Native Cost Management Features
Overview
Snowflake includes built-in tools for monitoring and controlling costs at the account and warehouse level. These native features provide a necessary foundation, though most teams doing serious Snowflake cost optimization will need third-party platforms to go further.
Standout Features
- Resource Monitors: Set credit limits on virtual warehouses to prevent runaway spend.
- Auto-Suspend and Auto-Resume: Automatically suspends warehouses after a configurable idle period.
- Account Usage Views: Historical usage data and cost queries via the ACCOUNT_USAGE schema.
- Query Profile: Analyzes query execution plans to identify performance bottlenecks.
Pros
- Included with all Snowflake plans at no additional cost
- Sufficient for basic cost visibility and alerting
- Query Profile is valuable for hands-on query debugging
Cons
- No lineage, usage context, or cross-tool visibility
- Auto-suspend has minimum idle thresholds that can still leave significant compute waste
- Reactive by design; no proactive recommendations or anomaly detection

Snowflake Cost Optimization Best Practices
Reducing Snowflake spend requires more than enabling auto-suspend. The practices below address the architectural decisions that drive the largest cost inefficiencies.
1. Right-Size Virtual Warehouses Using T-Shirt Sizing
Snowflake virtual warehouses scale in T-shirt sizes (XS through 6XL), and each increment doubles credit consumption per hour. Most teams default to larger warehouses to avoid query timeouts, but this creates chronic overspend during low-concurrency periods.
The right approach is to match warehouse size to query complexity and concurrency requirements. Ad hoc analytical queries often run efficiently on XS or S warehouses. ETL pipelines with high data volume benefit from M or L, but should use multi-cluster configurations to handle concurrency spikes rather than permanently running a larger single-warehouse size. Running workload profiling for two to four weeks before locking in warehouse sizing prevents over-provisioning that compounds into significant monthly waste.
2. Implement Clustering Keys on High-Scan Tables
Snowflake stores data in micro-partitions, each containing between 50 MB and 500 MB of uncompressed data. Without clustering keys, queries that filter on non-sequential columns must scan far more micro-partitions than necessary, resulting in significant increases in compute consumption.
Clustering keys tell Snowflake how to organize micro-partitions relative to specific column values. For tables frequently filtered by date, region, or another high-cardinality dimension, clustering dramatically reduces the number of micro-partitions scanned per query. The trade-off is reclustering cost: Snowflake continuously re-clusters data in the background as new rows arrive, which consumes cloud services credits. Teams should evaluate clustering keys only on tables with high query frequency and large data volume. For tables under 1 TB or queried infrequently, clustering adds cost rather than reducing it.
3. Use Materialized Views Strategically
Materialized views pre-compute and store query results as physical data objects. Unlike standard views, which re-execute their underlying query on every call, materialized views serve results directly from cached storage. This reduces compute for repeated, complex aggregations, particularly for downstream BI tools running the same queries repeatedly against large tables.
The cost consideration: Snowflake charges for maintaining materialized views as base table data changes. If the underlying table updates frequently and the materialized view is queried infrequently, maintenance costs will outweigh the compute savings. Materialized views are most cost-effective for stable, high-frequency read patterns. Standard views remain the right choice for queries that run rarely or where the base data is highly dynamic.
4. Monitor and Control the Cloud Services Layer
The cloud services layer covers query compilation, authentication, metadata management, and transaction handling. Snowflake provides this at no additional cost up to 10% of daily compute credits. Usage above that threshold is charged separately and often goes unnoticed until it appears on the monthly bill.
Teams running high volumes of short, frequent queries (common in Snowpipe ingestion patterns or BI tools with aggressive refresh schedules) are most exposed to cloud services overage. Auditing ACCOUNT_USAGE.QUERY_HISTORY for queries with very short execution times and high cloud_services_credits_used values identifies the workloads responsible. Batching small queries, reducing refresh frequency in BI tools, and using result caching to avoid redundant query compilation are effective mitigations.
5. Optimize File Sizes for Snowpipe and Batch Ingestion
Snowflake performs best when ingested files fall between 100 MB and 250 MB in uncompressed size. Files smaller than this create excessive micro-partition fragmentation, which increases query scan costs downstream. Files larger than this slow ingestion and limit parallelism.
For Snowpipe users, this typically means buffering data upstream (in S3, GCS, or Azure Blob Storage) before triggering ingestion, rather than loading every micro-batch as it arrives. For batch jobs, splitting or merging files to hit the target size range is worth the engineering investment, given the downstream query cost reduction.
6. Enforce Budget Controls with Resource Monitors
Resource monitors allow teams to set credit quotas on virtual warehouses at the account, warehouse, or custom level, and trigger automated actions (notify, suspend, suspend immediately) when thresholds are crossed. Most teams set monitors at the account level but skip warehouse-level controls, which leaves individual runaway warehouses unchecked until the account-level threshold is hit.
Setting warehouse-level resource monitors with notify thresholds at 75% and suspend thresholds at 100% of the expected weekly credit budget creates early warning and automated control. Pairing this with a documented alert escalation path ensures anomalies get resolved quickly.
7. Conduct Regular Usage Audits
Snowflake’s ACCOUNT_USAGE schema retains 365 days of historical data across queries, warehouses, storage, and data sharing. Monthly audits using QUERY_HISTORY, WAREHOUSE_METERING_HISTORY, and TABLE_STORAGE_METRICS identify patterns that automated tools may not surface: tables that were expensive six months ago and are now unused, warehouses sized up for a one-time project and never resized down, or pipelines whose business owners have changed.
Combining usage data with business context (which requires lineage-aware tooling) is what separates cost awareness from actionable cost reduction.

The Optimal Snowflake Optimization Journey
Effective Snowflake cost management follows a progression from visibility to accountability to automation. Teams that treat it as a periodic project rather than a continuous engineering practice consistently struggle to sustain savings.
Step 1: Observability with Context
Basic observability shows which queries are expensive. Contextual observability shows which downstream dashboards are triggering those queries, which teams own them, and whether the business outcome justifies the spend.
A table with terabytes of unclustered data supporting a rarely viewed dashboard looks like a query cost problem in isolation. With lineage, it becomes clear whether the dashboard is driving meaningful business outcomes or consuming compute for no real reason. That distinction changes the remediation path entirely.
Step 2: Ownership and Monitoring
Cost problems persist when no one is accountable for them. Monitoring should cover user behavior patterns, pipeline anomalies, and domain-level budget trends, as well as warehouse activity.
Root cause analysis tools close the loop between anomaly detection and resolution. An unexpected ETL cost spike traced to a recent query change with inefficient joins is fixable in hours when lineage connects the alert to the source. Without that connection, engineers spend days investigating.
Step 3: Continuous Optimization
Optimization aligned with actual usage patterns is more durable than one-off tuning efforts. Right-sizing warehouses for off-peak periods, refactoring queries based on real workload data, and archiving unused datasets all compound over time into sustained cost reduction.
The highest-value optimization insight most teams share: cost management performs best when it is built into the engineering workflow, not treated as a periodic cleanup exercise.
Maximize Efficiency with Strategic Snowflake Cost Optimization
Effective Snowflake cost management is a continuous process that requires the right combination of tools, architectural discipline, and usage accountability. Seemore Data leads the field by combining end-to-end observability, full-stack lineage, and autonomous optimization into a single platform. Paired with Finout for multi-cloud cost attribution, Chaos Genius for anomaly alerting, and SELECT.dev for targeted query tuning, data teams can build a complete cost control practice that scales with their stack.
FAQs
What are the best Snowflake tools for cost optimization?
The best Snowflake cost management tools combine cost monitoring, usage attribution, and actionable recommendations. Native Snowflake features provide basic visibility, but most data teams rely on external platforms to understand who is driving costs, why spend is increasing, and where optimizations can safely be applied across warehouses, pipelines, and BI usage. Based on automation depth and lineage coverage, Seemore Data, Finout, and SELECT.dev are the most commonly evaluated options in 2026.
How do the features of the top Snowflake cost management tools compare?
The feature comparison matrix at the top of this guide maps the six leading platforms across primary focus, auto-scaling capability, root cause analysis depth, and pricing model. The key differentiator across the field is whether a tool provides observability only, or combines observability with autonomous action and full-stack lineage. Seemore Data falls into the latter category; Finout and SELECT.dev are strong within specific domains but narrower in scope.
Why is Snowflake’s native cost monitoring not enough?
Snowflake’s native tools show what you spent, not what caused it. They lack deep lineage, usage context, and cross-tool visibility. Without knowing which dashboards, pipelines, or teams are triggering compute, cost optimization stays reactive and manual.
How do Snowflake cost optimization tools reduce compute spend?
Most tools start with observability, helping teams identify where compute is being consumed. More advanced platforms add anomaly detection, automated warehouse management, usage-based recommendations, and AI-driven root cause analysis powered by deep data lineage. The most effective tools enable continuous optimization across the entire data stack, rather than focusing only on query-level tuning or warehouse metrics.
What is the difference between warehouse optimization and stack-wide optimization?
Warehouse optimization focuses on query performance and warehouse sizing. Stack-wide optimization covers the full data flow, including ingestion, transformations, warehouses, and BI usage, to eliminate waste that warehouse-only tools cannot detect, such as abandoned dashboards or redundant pipelines.
Can Snowflake cost optimization be automated?
Yes. Modern platforms automate anomaly detection, warehouse resizing, budget monitoring and alerts, and root cause analysis using data lineage. Automation reduces costs continuously without requiring manual audits or ongoing firefighting.
How do data teams measure ROI from Snowflake cost optimization tools?
ROI is typically measured through reduced Snowflake compute credits, elimination of unused data assets, fewer engineering hours spent on troubleshooting, and better cost attribution across teams and projects. Teams often see measurable savings within weeks once usage-level visibility is in place.
Are Snowflake cost optimization tools safe to use in production?
Yes. Leading tools operate on metadata and usage patterns, not on actual data. This allows teams to optimize costs without impacting data integrity, performance, or security.