What is Snowflake Performance Tuning?
Snowflake Performance Tuning is essential for ensuring fast query execution, cost efficiency, and optimal resource utilization. As organizations scale their data operations, inefficient queries and misconfigured warehouses can lead to excessive compute costs and performance bottlenecks. Without proper tuning, even simple queries can take longer than necessary, impacting business decisions and increasing operational expenses.
One of the biggest challenges data teams face is balancing speed and cost. Slow queries often result from poor query design, excessive data scanning, or underutilized Snowflake’s optimization features. Additionally, failing to manage warehouse configurations properly can lead to unnecessary credit consumption, making cost overruns a common issue.
In this article:
- Why Performance Tuning in Snowflake Matters
- 7 Reasons Your Snowflake Queries Might Be Running Slow
- How Snowflake’s Architecture Influences Performance
- 4 Critical Best Practices for Performance Tuning in Snowflake
- 5 Common Mistakes in Snowflake Performance Tuning and How to Avoid Them
Why Snowflake Performance Tuning Matters?
Performance tuning in Snowflake is not just about speeding up queries. It directly impacts cost efficiency and user experience. Slow-running queries can delay critical business insights, frustrate analysts, and increase compute costs unnecessarily. Since Snowflake operates on a pay-as-you-go model, every second a query runs consumes compute credits, making optimization essential for cost control.
Snowflake’s pricing structure is based on compute and storage usage. Compute costs are tied to virtual warehouses, which scale dynamically based on workload demand. Poorly optimized queries often lead to excessive resource consumption, forcing organizations to run larger warehouses for longer periods. Additionally, inefficient data storage, such as unoptimized micro-partitions, can cause queries to scan more data than needed, further increasing costs.

7 Reasons Your Snowflake Queries Might Be Running Slow
Several factors can contribute to poor query performance in Snowflake. Understanding these common causes is the first step in diagnosing and resolving issues effectively.
1. Unoptimized Query Design
Poorly written SQL is a major source of slowness. This includes missing filters, excessive use of SELECT *, lack of appropriate joins, and not using subqueries or CTEs efficiently. Overly complex queries can also push the query planner into less efficient execution paths.
2. Large Data Scans
If queries scan more data than necessary, they consume more compute and time. This usually happens when filters aren’t selective enough, columns are unnecessarily included, or micro-partitions are not properly pruned. Partition pruning and clustering can help reduce scanned data volumes.
3. Missing or Poor Clustering
Snowflake automatically organizes data into micro-partitions, but without proper clustering on high-cardinality columns (like timestamps or user IDs), performance can degrade over time. Especially for large datasets, the lack of clustering can lead to full table scans.
4. Inefficient Joins and Lack of Statistics
Joining large tables without filters or broadcasting small tables to large ones can overload compute resources. Additionally, if Snowflake lacks updated statistics, it may choose suboptimal join strategies.
5. Warehouse Misconfiguration
Running queries on under-provisioned warehouses can result in slower performance, especially for resource-intensive workloads. Conversely, oversizing warehouses can lead to high costs without much performance gain.
6. High Concurrency and Queuing
When too many queries run simultaneously, smaller warehouses can get overwhelmed, leading to queuing delays. Autoscaling can help, but it must be configured correctly to avoid both performance degradation and unnecessary credit usage.
7. Missing Caching Opportunities
Snowflake supports result set caching, metadata caching, and data caching. If queries are not written to take advantage of caching—such as by adding unnecessary variability in syntax or lack of parameterization—they may rerun unnecessarily instead of retrieving cached results.
Addressing these issues requires a combination of query refactoring, data model adjustments, and warehouse configuration tuning. By identifying where queries are spending time—whether in scan, join, or execution phases—teams can take targeted action to improve performance.
How Snowflake’s Architecture Influences Performance
Snowflake’s unique architecture is designed for scalability and efficiency, but understanding its core components is essential for effective performance tuning. Unlike traditional databases, Snowflake’s architecture separates storage and compute, enabling organizations to scale resources independently based on workload demands.
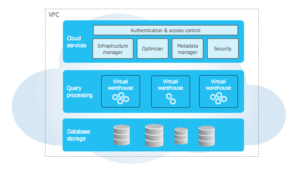
Separation of Storage and Compute
In Snowflake, data is stored in a centralized location, while compute power comes from virtual warehouses that process queries. This separation provides flexibility, allowing users to scale compute resources up or down without affecting data storage. However, improper warehouse sizing or inefficient query execution can lead to wasted compute credits. To optimize performance, teams should:
- Choose the right warehouse size based on workload complexity.
- Enable auto-suspend and auto-resume to avoid idle compute costs.
- Run queries in the smallest possible warehouse that meets performance needs.
Micro-Partitions and Clustering
Snowflake automatically organizes data into micro-partitions, which improve query speed by reducing the amount of data scanned. However, if a table’s natural data order doesn’t align with query patterns, performance can suffer. Clustering can help by logically grouping related data, minimizing unnecessary scans. Best practices include:
- Using clustering keys on frequently filtered columns.
- Monitoring partition pruning efficiency with query profiles.
- Avoiding excessive manual clustering, which can increase costs.
Snowflake Query Optimizer
The Snowflake query optimizer automatically determines the best execution plan based on available statistics and table metadata. While Snowflake handles many optimizations internally, manual tuning can help in cases where performance issues persist. Users should:
- Analyze query plans using EXPLAIN to identify bottlenecks.
- Optimize JOIN conditions and avoid unnecessary cross-joins.
- Leverage materialized views and result caching when applicable.
By leveraging Snowflake’s architecture effectively, teams can maximize performance while keeping costs under control.
4 Critical Best Practices for Performance Tuning in Snowflake
Optimizing Snowflake’s performance requires a combination of efficient query design, proper storage management, and strategic resource scaling. By implementing the following best practices, data teams can enhance query speed, reduce costs, and maximize the platform’s capabilities.
1. Optimizing Query Design
Poorly structured queries can slow down performance and lead to excessive compute costs. Snowflake’s query engine is designed to optimize execution plans automatically, but following these best practices ensures optimal performance:
- Use SELECT specific columns instead of SELECT * – Retrieving only the necessary columns reduces data scanned, improving execution speed. Using SELECT * forces Snowflake to read all columns, even if they are not required.
- Write efficient WHERE and JOIN conditions – Filtering data early in queries improves performance by reducing the number of scanned micro-partitions. Ensure filter conditions use indexed or frequently queried columns to maximize partition pruning.
- Leverage Common Table Expressions (CTEs) instead of deep subqueries – CTEs improve readability and reusability, reducing redundant computations.
- Optimize JOIN operations – When joining large datasets, ensure columns used in joins are of the same data type to prevent implicit conversions, which slow query execution. Additionally, use HASH joins when working with large tables.
2. Using Clustering and Micro-Partitions Effectively
Snowflake automatically partitions data into micro-partitions, enabling fast data retrieval by minimizing scanned storage. However, performance can degrade if data is not well-organized for typical query patterns.
- Use automatic clustering for dynamic datasets – Snowflake’s automatic clustering continuously reorganizes data, improving query efficiency without manual intervention.
- Manually define clustering keys for large, frequently queried tables – If queries consistently filter by specific columns (e.g., date or customer_id), defining a clustering key ensures Snowflake physically groups related data together, reducing scan time.
- Check partition pruning effectiveness – Use EXPLAIN and query profiles to verify that Snowflake is scanning the expected number of partitions. If excessive partitions are scanned, re-evaluate clustering strategies.
- Avoid excessive clustering – While clustering can improve performance, unnecessary clustering can increase compute costs. Regularly analyze whether clustering benefits outweigh its cost.
3. Leveraging Result Caching and Query Pruning
Snowflake’s caching mechanisms significantly reduce query execution time and compute costs when used correctly.
- Result Cache – If a query is identical to a previous query and the underlying data hasn’t changed, Snowflake returns the cached result instantly, eliminating compute usage.
- Metadata Cache – Snowflake stores metadata about tables and partitions, allowing faster query compilation and execution. Ensure queries use well-defined WHERE clauses for effective partition pruning.
- Query Pruning – Snowflake automatically prunes unnecessary partitions when queries contain efficient filtering conditions. Use date-based partitions and avoid functions like TO_CHAR(date_column, ‘YYYY-MM’), which prevent pruning.
4. Scaling Compute Resources Wisely
Selecting the right warehouse size and managing compute resources effectively is crucial for balancing performance and cost.
- Choose the smallest warehouse that meets performance needs – Scaling up too aggressively wastes compute credits, while undersized warehouses slow query execution.
- Enable auto-suspend and auto-resume – Prevent unnecessary compute costs by suspending warehouses during inactivity and resuming them when queries are submitted. A low auto-suspend threshold (e.g., 60 seconds) prevents idle compute waste.
- Use multi-cluster warehouses for high concurrency – If multiple users or workloads run simultaneously, enabling multi-cluster warehouses prevents bottlenecks by distributing queries across additional clusters.
- Monitor warehouse utilization – Regularly review Query History and Warehouse Load Charts to ensure warehouses are appropriately sized for workloads. If warehouses consistently run at full capacity, consider increasing size or enabling multi-cluster mode.
By applying these best practices, data teams can enhance Snowflake’s performance, reduce query execution time, and optimize cost efficiency.
Common Mistakes in Snowflake Performance Tuning and How to Avoid Them
Even experienced data teams can run into performance issues in Snowflake if they overlook key optimization techniques. Here are some of the most common mistakes and how to avoid them.
1. Over-relying on Larger Warehouses Instead of Optimizing Queries
One of the most common misconceptions is that increasing the virtual warehouse size will automatically improve performance. While larger warehouses provide more compute power, they do not fix poorly written queries or inefficient data structures.
How to avoid this mistake:
- Before scaling up, analyze query execution plans to identify inefficiencies.
- Optimize queries by reducing data scans, improving filtering, and using clustering keys effectively.
- Use auto-scaling and multi-cluster warehouses for concurrency instead of permanently increasing warehouse size.
2. Ignoring Snowflake’s Query Profiling Tools (EXPLAIN, Query History)
Snowflake provides built-in tools like EXPLAIN plans and Query History to help users understand query execution patterns. Failing to analyze queries can lead to inefficient execution, unnecessary full-table scans, and excessive compute costs.
How to avoid this mistake:
- Use EXPLAIN to analyze query execution plans and identify performance bottlenecks.
- Check Query History to track warehouse usage, query duration, and scanned partitions.
- Optimize slow queries by reducing scan volume and restructuring inefficient joins.
3. Failing to Use Materialized Views or Clustering Effectively
Materialized views and clustering can significantly improve query performance, but many teams either misuse them or fail to implement them at all.
How to avoid this mistake:
- Use Materialized Views for frequently executed aggregation queries to reduce computation time.
- Define clustering keys on large tables with predictable filtering patterns, such as date-based columns.
- Regularly review clustering performance and avoid unnecessary reclustering operations that increase costs.
4. Inefficient Data Storage Leading to Poor Pruning Performance
Snowflake relies on micro-partitions to improve query efficiency, but poor data storage practices can prevent effective partition pruning. If queries scan more partitions than necessary, performance suffers.
How to avoid this mistake:
- Ensure date columns and high-cardinality fields are used effectively for partition pruning.
- Avoid transforming date fields in WHERE clauses (e.g., TO_CHAR(created_at, ‘YYYY-MM’) prevents pruning).
- Use EXPLAIN to check if queries are scanning excessive partitions and optimize filtering conditions accordingly.
5. Overusing Complex Joins Without Considering Indexing Strategies
While Snowflake does not use traditional indexes, inefficient joins can still cause performance bottlenecks. Queries that involve large tables with multiple joins can lead to unnecessary data shuffling and slow execution.
How to avoid this mistake:
- Ensure JOIN conditions use columns with the same data type to avoid implicit conversions.
- Where possible, denormalize data to reduce the number of joins in frequently run queries.
- Consider using temporary tables or Common Table Expressions (CTEs) to break down complex queries into smaller, more efficient steps.
By avoiding these common mistakes, teams can ensure Snowflake operates at peak efficiency, delivering fast queries and optimized compute costs.
Optimizing Snowflake Performance with Seemore Data