Understand warehouse performance. Fix what matters.
Data warehouses are easy to spin up, but hard to keep efficient. Over-provisioned compute, scattered settings, and hidden bottlenecks quietly drain performance and budget. Small issues like spillage or queue delays snowball into larger costs, and finding the root cause takes too long.
Get a clear, unified view of warehouse behavior, and prevent your team from guessing what to scale, when to intervene, or how to optimize.
Get a full view of configuration, cost, and compute behavior across every Data warehouse.
Spot inefficiencies fast, see the tradeoffs between cost and speed before making a change, and set SLA priorities so recommendations align with each warehouse’s role. Whether you’re tuning for cost or performance,


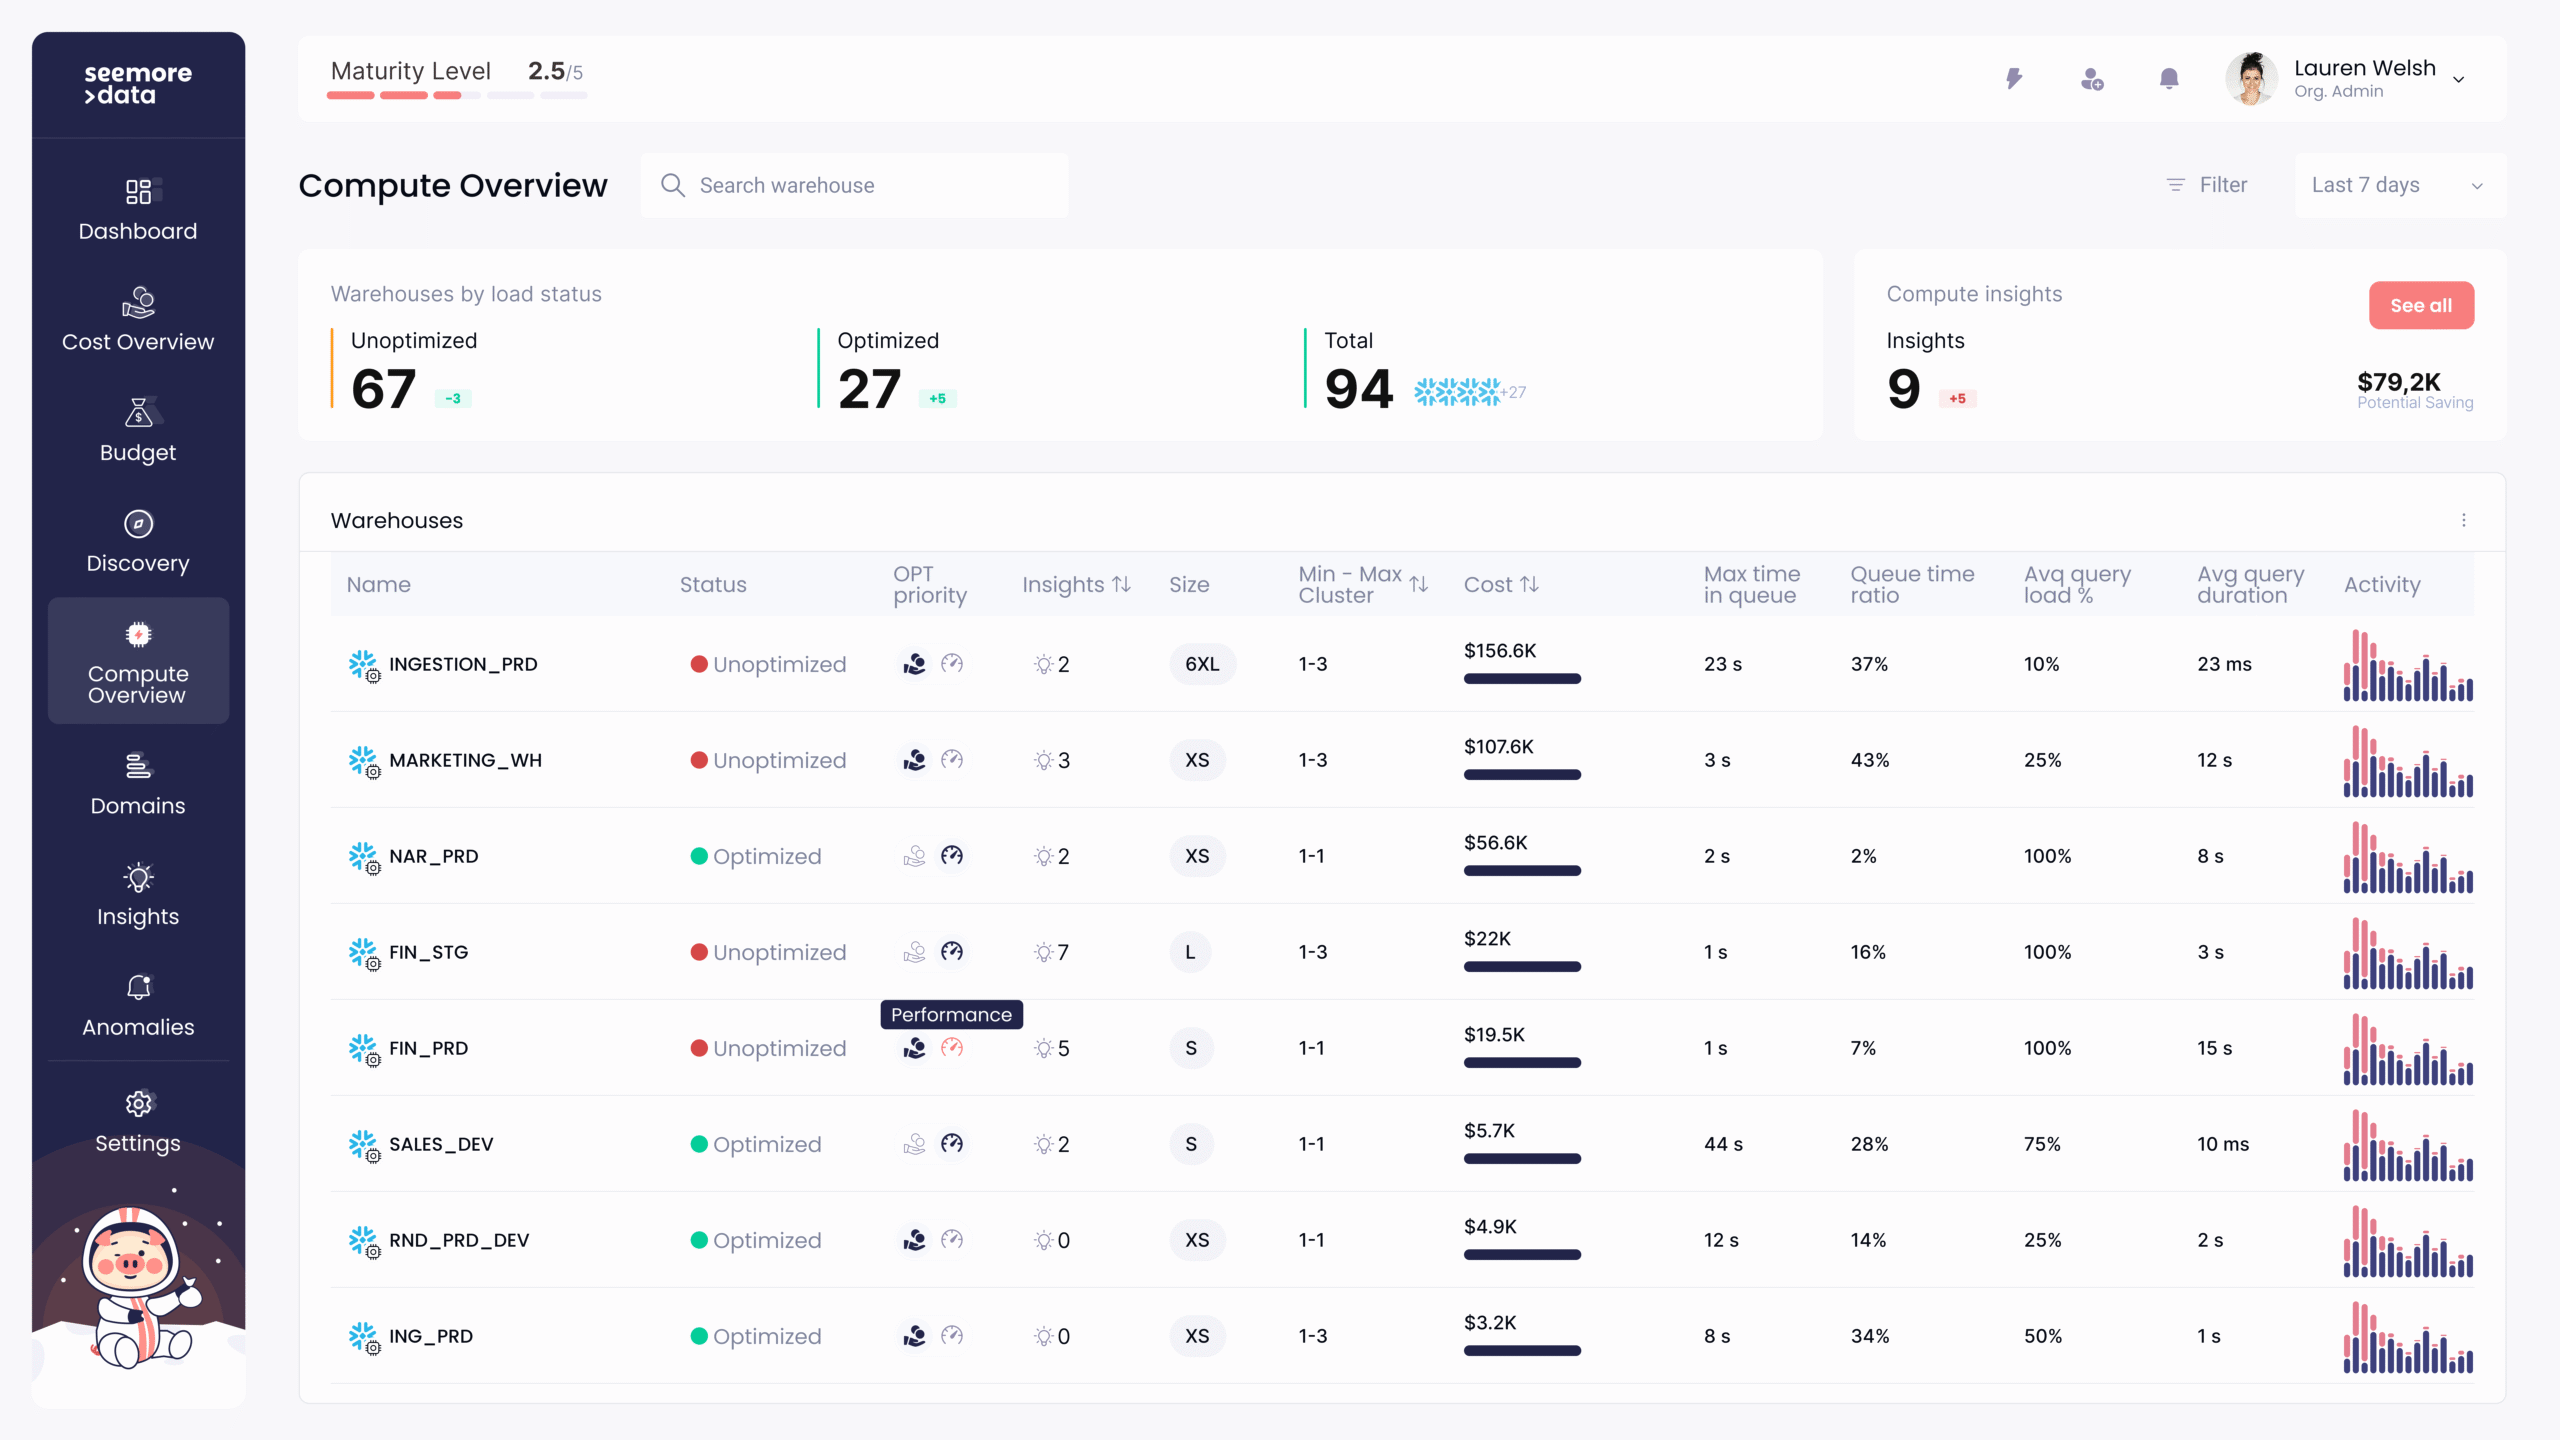

Get a complete view of all your warehouses, including optimization status, costs, cluster activity, and performance KPIs.

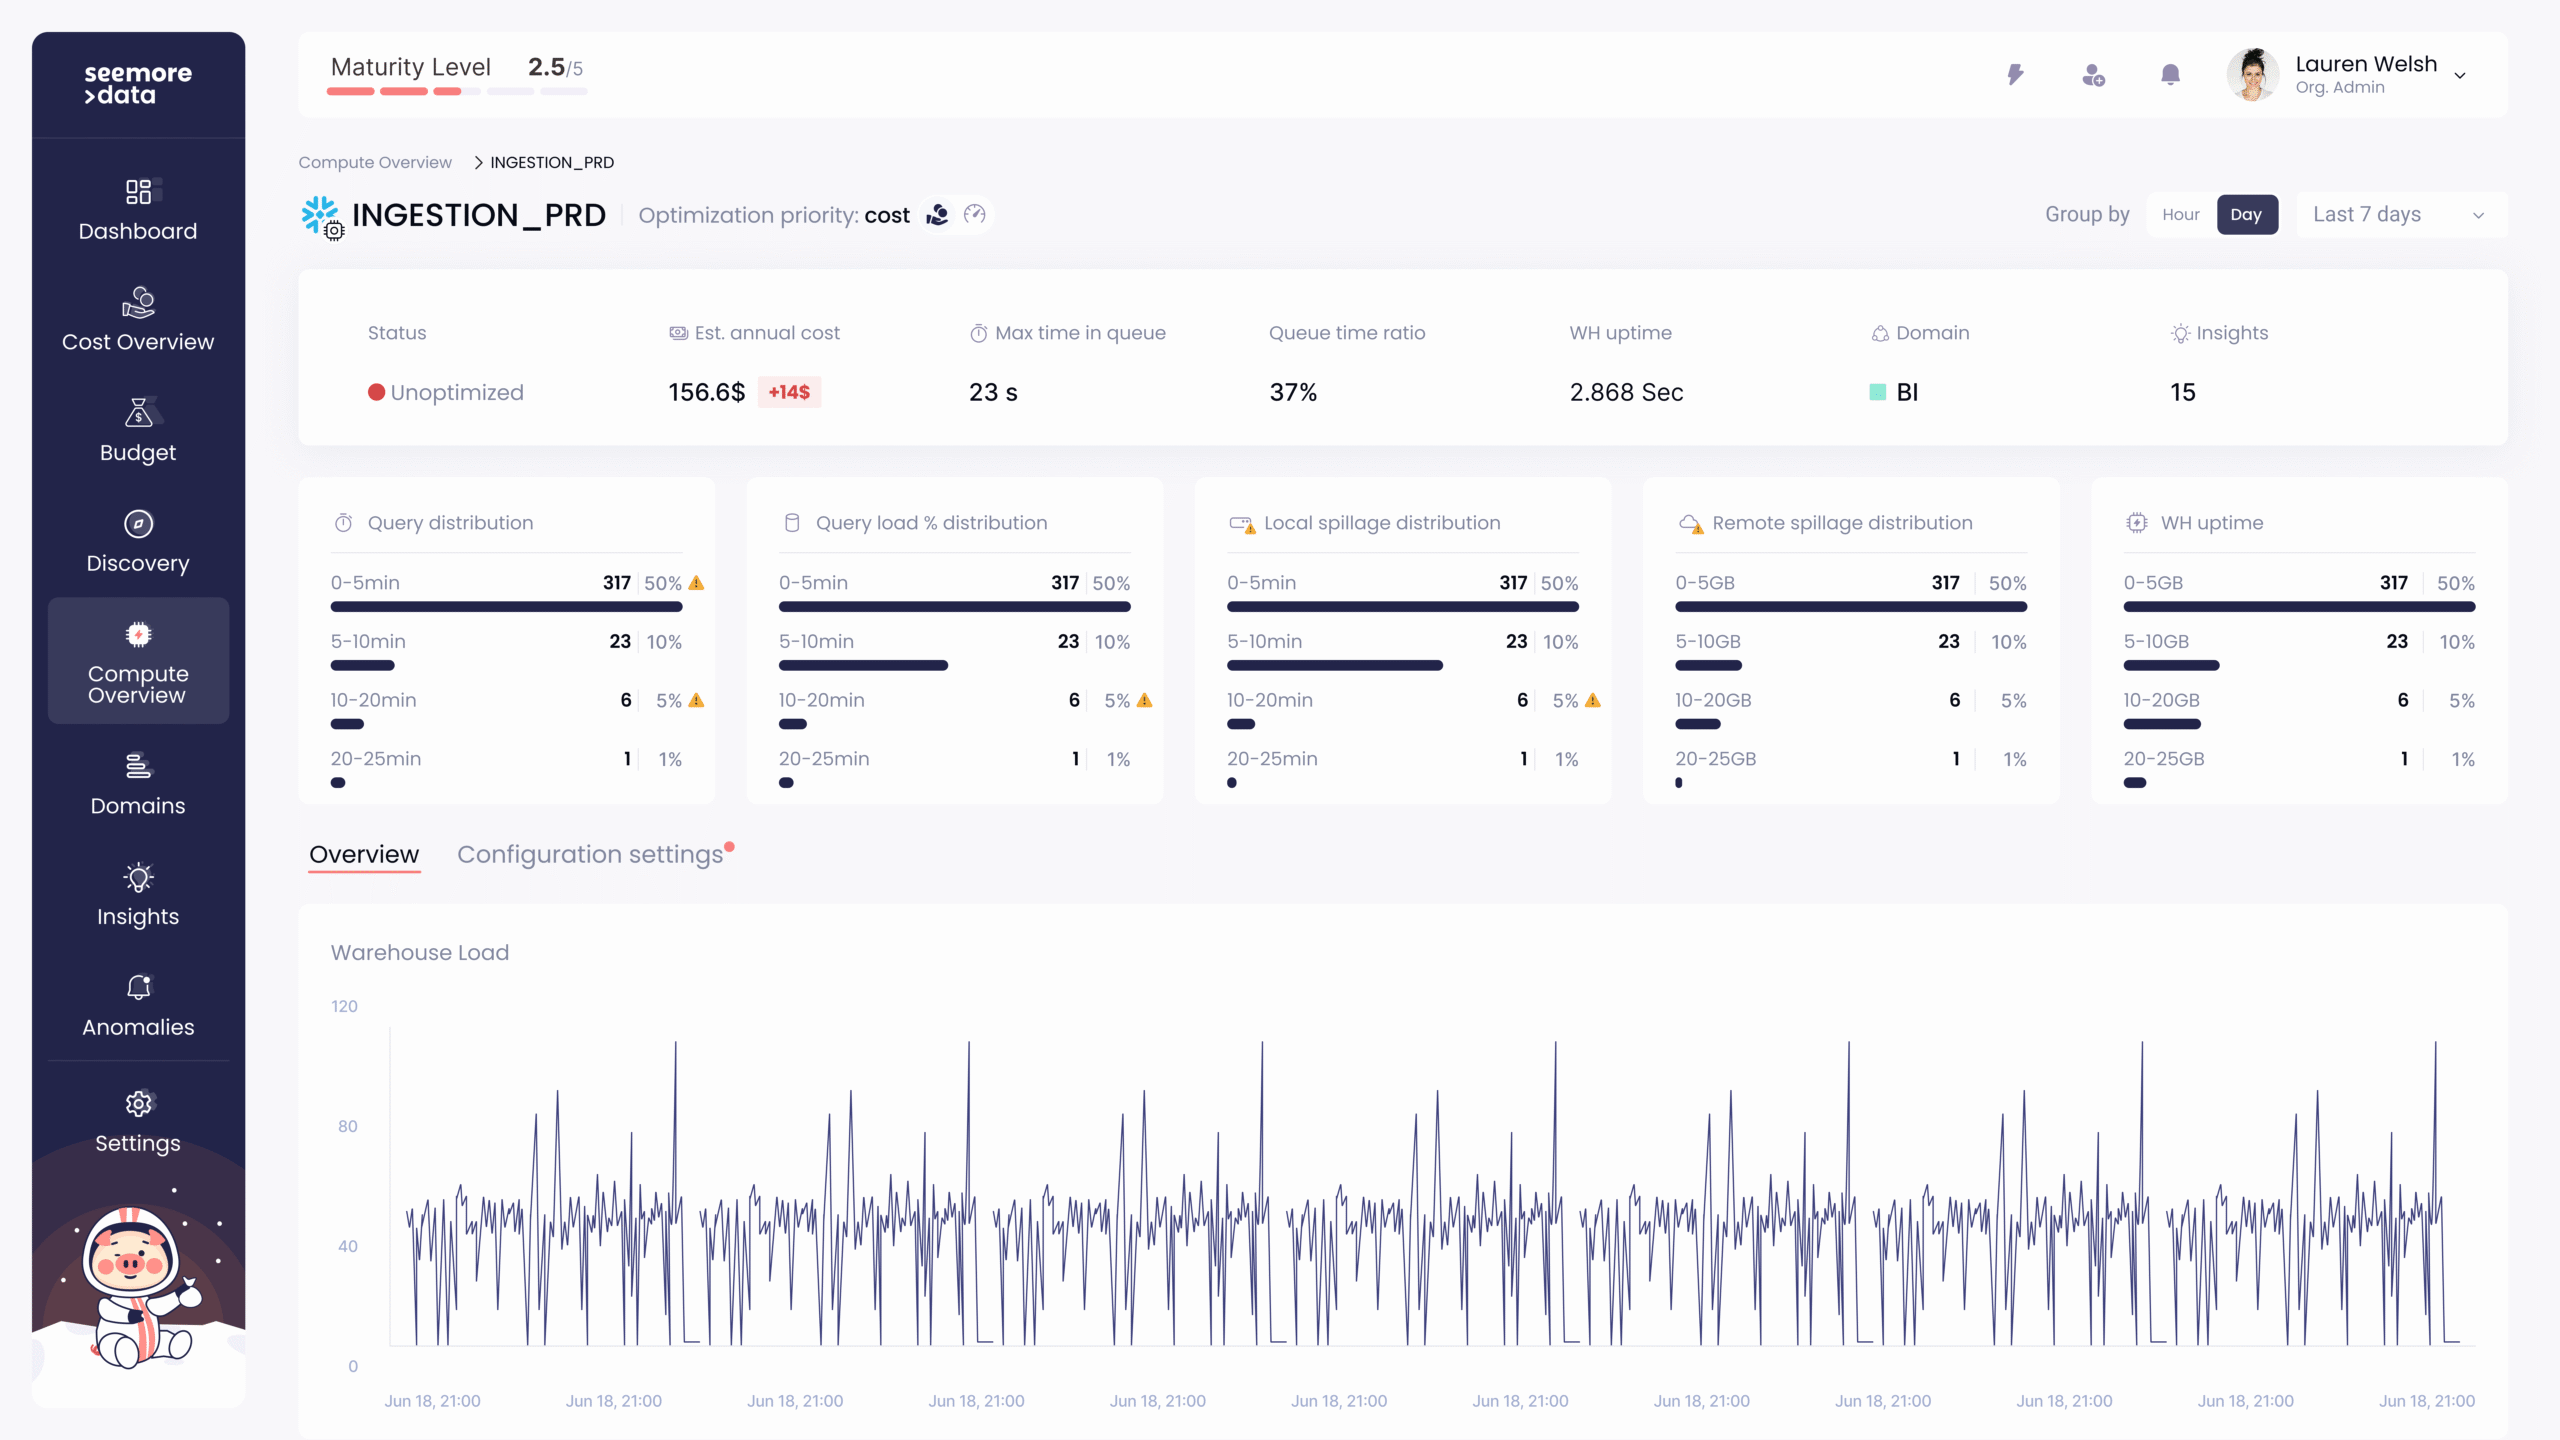
Drill into activity graphs and load patterns. Identify delayed queries, spillage, and inefficiencies in real time.

Visual alerts highlight queue delays, spillage, and query load. See what is misconfigured and why it matters.

Review and adjust warehouse configurations like size, suspend timers, cluster setup, and scaling policies with full context.

Target cost or performance based on your priorities. Seemore adapts its recommendations to match your goals.

Apply one-click fixes for common issues or follow step-by-step guidance tied to real metrics and their impact.

How a one-line config saved $30K in Snowflake compute, switching to Iceberg Auto-Refresh >>

How Tipalti's data team saved 40% of their yearly spend >>

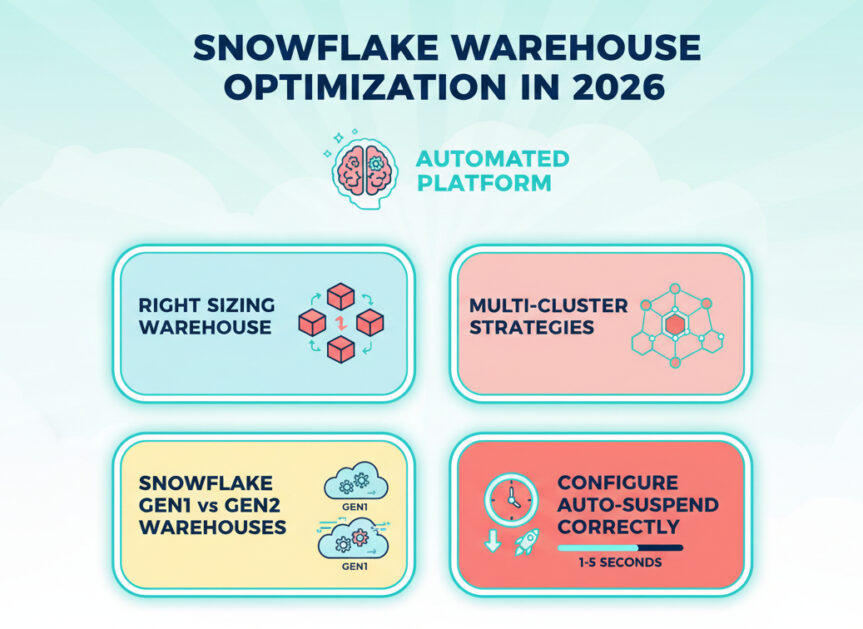
Snowflake Gen 2 standard warehouses: a cost-performance deep dive >>

Snowflake resource monitors: optimizing costs and managing usage >>