
Data Platform Unit Economics: How to Calculate Cost Per Pipeline, Dashboard, and Model Run

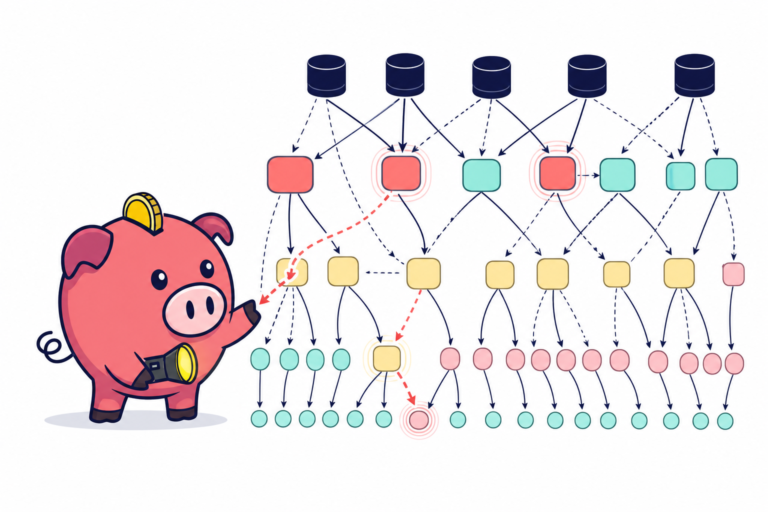
There’s a conversation happening in CDO offices right now that goes roughly like this: “We’re spending $300,000 a month on Snowflake. Is that good?”
Nobody can answer that question. Not because the number is hard to find – Snowflake will tell you exactly what you spent. But because $300,000 in total compute spend tells you nothing about whether that spend is efficient, wasteful, or well-allocated.
Data platform unit economics changes that question entirely. Instead of “how much are we spending?” it asks: “how much does it cost to run each pipeline, refresh each dashboard, train each model, and serve each active user?” Those are questions you can act on.
The FinOps Foundation’s 2026 analysis explicitly names cost per pipeline, per dashboard, and per model run as the next frontier for data platform optimization – the metrics that separate teams managing a cost center from teams running a strategic data platform. This article gives you the framework and the SQL to get there.
Table of Contents
- TL;DR
- What Are Data Platform Unit Economics?
- The 5 Core Data Platform Unit Metrics
- Why Total Spend Metrics Are Not Enough
- From Manual Calculation to Continuous Unit Intelligence
- FAQ
TL;DR
- Data platform unit economics = measuring cost per unit of output, not aggregate monthly spend
- The five core metrics: cost per pipeline run, cost per dashboard refresh, cost per model training run, cost per active user served, cost per data product
- Aggregate spend metrics tell you how much you’re spending – unit metrics tell you whether it’s worth it
- Snowflake’s
ACCOUNT_USAGEschema contains everything you need to calculate each metric - Snowflake Cortex AI adds a token-based cost dimension that changes the unit economics of AI-powered pipelines
- Seemore attributes Snowflake cost to the jobs, users, domains and data products behind it, in real time, with no custom SQL
What Are Data Platform Unit Economics?
Data platform unit economics is the practice of measuring the cost of your data infrastructure at the output level – per pipeline run, per dashboard view, per model execution – rather than as an aggregate monthly or annual figure.
The concept is borrowed from SaaS business economics, where unit economics (cost per acquisition, revenue per user, gross margin per customer) are the metrics that determine whether a business is sustainable at scale. Applied to data platforms, the same principle holds: a platform that costs $300K/month might be excellent value if it powers 10,000 pipeline runs daily, or completely uneconomical if it powers 50.
Most data teams today operate with one number: total warehouse spend. Data platform unit economics gives you five numbers that are actually useful.
The 5 Core Data Platform Unit Metrics
Each metric below follows the same structure: a definition, a formula, implementation SQL for Snowflake, and what “good” looks like.
1. Cost Per Pipeline Run
The most actionable unit metric for data engineering teams. Cost per pipeline run measures how much compute each pipeline execution consumes – making it possible to compare efficiency across pipelines, track trends over time, and identify regressions when a pipeline suddenly costs 3x more than its baseline.
Formula: Total credits consumed by pipeline queries ÷ number of pipeline runs in the period
Snowflake implementation:
SELECT
query_tag AS pipeline_name,
COUNT(*) AS total_queries,
ROUND(SUM(credits_attributed_compute + COALESCE(credits_used_query_acceleration, 0)), 4) AS total_credits,
ROUND(AVG(credits_attributed_compute + COALESCE(credits_used_query_acceleration, 0)), 6) AS avg_credits_per_query
FROM snowflake.account_usage.query_attribution_history
WHERE start_time >= DATEADD(day, -30, CURRENT_TIMESTAMP())
AND query_tag != ''
GROUP BY query_tag
ORDER BY total_credits DESC;
QUERY_ATTRIBUTION_HISTORY splits each warehouse’s metered credits across the queries that ran on it, so warehouse size, generation and concurrency are already accounted for. It leaves out warehouse idle time and very short queries (about 100 ms or less), and can lag by up to eight hours, so totals will sit a little below your bill. If one run issues many queries, add a run identifier to the tag (for example orders_daily:2026-10-21) so each run can be totalled on its own.
What good looks like: Pipelines with consistent cost per run and low variance. A pipeline that costs 0.05 credits on Monday and 2.3 credits on Thursday has a problem – and now you can see it.
Optimization lever: Sort by total_credits descending. In most accounts a small share of pipelines accounts for most of the compute, so start at the top of the list.
2. Cost Per Dashboard Refresh
BI tools – Tableau, Looker, Power BI, Sigma – run queries against your warehouse every time a dashboard loads or auto-refreshes. For most data teams, this is a significant but entirely invisible cost category. Cost per dashboard refresh makes it visible.
Formula: Total credits consumed by BI tool queries for a dashboard ÷ number of refreshes in the period
Snowflake implementation:
SELECT
query_tag AS dashboard_identifier,
COUNT(*) AS total_queries,
ROUND(SUM(credits_attributed_compute + COALESCE(credits_used_query_acceleration, 0)), 4) AS total_credits,
ROUND(AVG(credits_attributed_compute + COALESCE(credits_used_query_acceleration, 0)), 6) AS avg_credits_per_query
FROM snowflake.account_usage.query_attribution_history
WHERE start_time >= DATEADD(day, -30, CURRENT_TIMESTAMP())
AND (
query_tag ILIKE '%tableau%'
OR query_tag ILIKE '%looker%'
OR query_tag ILIKE '%sigma%'
OR query_tag ILIKE '%powerbi%'
)
GROUP BY query_tag
ORDER BY total_credits DESC;
This relies on your BI tool setting a query tag. If it doesn’t, filter on the BI tool’s service user instead (user_name is in the same view).
What good looks like: There is no universal number, so compare each dashboard with the rest of your account. One that costs many times the median per load is a candidate for caching, materialized views, or a refresh schedule review.
Optimization lever: Cross-reference cost per refresh against actual view frequency from your BI tool’s usage logs. High cost + low views = the first target for optimization or decommissioning.
3. Cost Per ML Model Training Run
For teams running ML workloads on Snowflake or Databricks – including pipelines that use Snowflake Cortex AI functions – cost per model run is the unit metric that determines whether your AI infrastructure is economically sustainable.
Cortex AI adds a token-based cost dimension on top of standard compute credits. When a pipeline calls Cortex AI functions like AI_COMPLETE or AI_CLASSIFY as part of feature engineering or inference, the Snowflake Cortex pricing applies per token consumed – in addition to the warehouse credits the query uses. A model run that looks cheap at the warehouse level can be expensive when Cortex AI token consumption is factored in.
Formula: (Compute credits + Cortex AI token credits) × credit price ÷ number of model runs
Snowflake Cortex AI query:
WITH ai AS (
SELECT query_id, query_tag, SUM(credits) AS ai_credits
FROM snowflake.account_usage.cortex_ai_functions_usage_history
WHERE start_time >= DATEADD(day, -30, CURRENT_TIMESTAMP())
AND query_tag != ''
GROUP BY query_id, query_tag
)
SELECT
ai.query_tag AS model_pipeline,
COUNT(*) AS total_queries,
ROUND(SUM(ai.ai_credits), 4) AS total_ai_credits,
ROUND(SUM(COALESCE(q.credits_attributed_compute, 0)), 4) AS total_compute_credits,
ROUND(SUM(ai.ai_credits + COALESCE(q.credits_attributed_compute, 0)), 4) AS total_credits
FROM ai
LEFT JOIN snowflake.account_usage.query_attribution_history q
ON q.query_id = ai.query_id
GROUP BY ai.query_tag
ORDER BY total_credits DESC;
AI function credits are billed separately from warehouse credits, so they sit in their own view, CORTEX_AI_FUNCTIONS_USAGE_HISTORY. The join adds the warehouse credits each of those queries used. The view’s query tag column is filled for usage from 16 February 2026 onward.
What good looks like: Stable cost per run with low variance. A model whose cost per run is increasing over time – without a corresponding improvement in output quality – is over-consuming resources somewhere in the training loop.
Optimization lever: For Cortex AI workloads, evaluate whether full-table Cortex function calls can be replaced with sampled or pre-filtered datasets. The token cost difference is significant at scale. See our guide to AI agent data costs for more on Snowflake Cortex pricing in agentic contexts.
4. Cost Per Active User Served
Cost per active user is the hardest metric to calculate precisely and the most strategic for data platform leaders. It answers: “how much does it cost to deliver the data platform to each person who actually uses it?”
This metric is particularly valuable for chargeback vs showback conversations – when you can show a business unit that each of their 20 active analysts costs $X/month in platform resources, cost accountability becomes concrete.
Formula: Total platform compute cost in period ÷ number of distinct active users who ran queries in that period
Snowflake implementation:
WITH user_cost AS (
SELECT
user_name,
COUNT(*) AS query_count,
SUM(credits_attributed_compute + COALESCE(credits_used_query_acceleration, 0)) AS total_credits
FROM snowflake.account_usage.query_attribution_history
WHERE start_time >= DATEADD(day, -30, CURRENT_TIMESTAMP())
GROUP BY user_name
)
SELECT
user_name,
query_count,
ROUND(total_credits, 4) AS total_credits,
ROUND(AVG(total_credits) OVER (), 4) AS avg_credits_per_active_user
FROM user_cost
ORDER BY total_credits DESC;
Service accounts that run pipelines will sit at the top of this list. Exclude them to see what the platform costs per person.
What good looks like: A stable figure month to month, measured against your own baseline. Outliers on the high end are usually power users running expensive exploratory queries on oversized warehouses – the first candidates for warehouse right-sizing or query governance.
Optimization lever: Segment users by role. Analysts running interactive queries should be on smaller warehouses than engineers running batch pipelines. The cost-per-user metric surfaces misalignment between warehouse sizing and actual usage patterns.
5. Cost Per Data Product
Cost per data product is the emerging standard for mature data platforms – especially those operating on data mesh principles, where each domain owns its data products end to end.
A data product might be a set of curated tables, a real-time dashboard, an ML feature store, or an API. Whatever the form, cost per data product answers the question that every CDO eventually asks: “does the value this data product delivers justify what it costs to build and maintain?”
Formula: Sum of all compute costs (pipeline runs + dashboard refreshes + maintenance queries) attributable to the data product ÷ number of data products (or per product individually)
Implementation approach: This metric requires consistent tagging of all queries associated with a data product. Use a compound query tag format: product::[product_name]::pipeline::[pipeline_name]. Once tagging is in place, the aggregation is straightforward using the pipeline cost query above, grouped by product prefix.
What good looks like: Every data product should have a named owner, a cost baseline, and a usage metric alongside it. A data product that costs $2,000/month to maintain and has 3 active consumers is a different conversation than one that costs $200/month and serves 500.
Why Total Spend Metrics Are Not Enough
Consider two data teams. Both spend $200,000/month on Snowflake. Team A has 400 pipelines running at an average cost of $0.12 per run. Team B has 400 pipelines where 12 of them account for $160,000 of the total spend – and nobody knows which 12.
Both teams see the same number on their invoice. Only Team A has the data platform unit economics to do something about it.
The argument for unit economics isn’t that aggregate spend is meaningless – it’s that it’s not actionable. A Snowflake cost increase diagnosed at the aggregate level produces an investigation. Diagnosed at the unit level, it produces a fix.
The teams building data platforms as strategic infrastructure in 2026 are the ones measuring cost per output, not cost per month. Unit economics is what lets a CDO walk into a board meeting and say: “our cost per data product delivered has decreased 40% year-over-year while output has doubled.” That’s a business conversation, not an IT budget conversation.
From Manual Calculation to Continuous Unit Intelligence
The SQL above gives you a starting point. The problem is that running it manually – across all pipelines, all users, all dashboards, all data products – is a full-time job. And it’s point-in-time: by the time you’ve calculated your unit metrics for last month, this month’s anomalies are already compounding.
Data platform unit economics needs to be continuous, not periodic.
Seemore attributes your Snowflake cost to the jobs, users, domains and data products behind it, in real time, and tracks your most expensive data products. When a pipeline’s cost starts trending up, you see it in Seemore before it becomes a billing anomaly. When a data product’s monthly cost doubles without a corresponding increase in usage, Seemore flags it.
You don’t need a data engineer to run cost queries every week. You need a cost intelligence layer that does it for you – and tells you which number to look at.
Ready to measure your data platform unit economics?
See cost by pipeline, user, domain and data product – in real time, without writing a single query.
FAQ
What are data platform unit economics?
Data platform unit economics is the practice of measuring infrastructure cost at the output level – cost per pipeline run, per dashboard refresh, per model training run, per active user served, and per data product – rather than as an aggregate monthly total. It’s the difference between knowing how much your data platform costs and knowing whether that cost is justified by the value it produces.
How do you calculate cost per query in Snowflake?
Query the SNOWFLAKE.ACCOUNT_USAGE.QUERY_ATTRIBUTION_HISTORY view. Its CREDITS_ATTRIBUTED_COMPUTE column gives the warehouse credits each query used (add CREDITS_USED_QUERY_ACCELERATION for accelerated queries). Multiply by your per-credit cost (typically $2–$4 depending on your Snowflake contract). The view leaves out warehouse idle time and queries of about 100 ms or less. Estimating from QUERY_HISTORY instead (execution time times the warehouse’s hourly credit rate) overstates the cost when queries run at the same time.
What metrics should data teams use to measure FinOps success?
The most actionable FinOps metrics for data teams are: cost per pipeline run (operational efficiency), cost per dashboard refresh (BI tool cost control), cost per model training run (AI/ML cost sustainability), cost per active user (platform ROI per consumer), and cost per data product (strategic value attribution). Total warehouse spend is a lagging indicator – these five metrics are leading ones.
How does Snowflake Cortex AI pricing affect data platform unit economics?
Snowflake Cortex AI adds a token-based cost layer on top of standard compute credits. When pipelines or ML workflows call Cortex AI functions – AI_COMPLETE, AI_CLASSIFY, AI_EXTRACT, AI_SENTIMENT – each call consumes tokens priced based on the Cortex model used and data volume processed. This means the unit economics of AI-powered pipelines compound on two axes: warehouse credits and Cortex AI token credits. Teams calculating cost per model run need to include both dimensions to get an accurate number.


