Gen1 vs Gen2 Snowflake Warehouses : When Does the 25% Premium Pay Off?


Snowflake Gen2 warehouses deliver 30-60% faster performance through improved CPU architecture, wider vector throughput, and faster memory bandwidth. But they cost 25% more per second (35% on AWS). The critical question: Which queries run fast enough on Gen2 to offset the higher cost?
Answer: Compute-intensive queries (aggregations, filters, DML operations) benefit significantly. Memory-bound queries with spillage to remote storage see minimal improvement. This post provides a classification framework to identify which workloads justify Gen2 migration.
Understanding Warehouse Performance: The Foundation
Before evaluating Gen1 vs Gen2, you need to understand what drives query performance in Snowflake. When we assess the right warehouse configuration for any workload, we analyze key metrics that correlate with runtime predictability and cost efficiency.
As we discussed in our vertical scaling guide, the decision to scale up (larger warehouse) versus maintaining your current size depends on understanding your query’s bottlenecks.
Key Performance Indicators
- Query Load PercentageHow much of the warehouse’s capacity is actively processing queries vs. idle.
- Data Scanned VolumeThe amount of data read from storage to execute the query.
- Spillage to DiskWhen query processing exceeds available memory:
- Local spillage (SSD): Slower but manageable
- Remote spillage (S3/cloud storage): Severe performance degradation
- Execution Time BreakdownWhere does the query spend time?
- CPU processing: Aggregations, transformations, calculations
- I/O operations: Reading from disk, network transfers
- Memory operations: Sorting, joining, window functions
These same KPIs apply when evaluating Gen1 vs Gen2, but the underlying hardware differences change the equation.
Gen2 Architecture: What Actually Changed
Snowflake Gen2 warehouses aren’t just “faster Gen1.” They represent a fundamental hardware upgrade with specific architectural improvements.
Core Gen2 Enhancements
- Faster Instructions Per Cycle (IPC)
- What it means: Each CPU core processes more instructions in a single clock cycle.
- Impact: Compute-heavy operations (aggregations, filters, transformations) complete 30-60% faster.
- Example:
SELECT
product_category,
SUM(revenue) as total_revenue,
AVG(quantity) as avg_quantity
FROM sales
WHERE sale_date >= ‘2025-01-01’
GROUP BY product_category;Gen1 execution: 120 seconds
Gen2 execution: 50 seconds (58% faster)
Cost comparison: Gen1 = 0.033 credits | Gen2 = 0.017 credits × 1.25 = 0.021 credits
Net result: 36% cost reduction despite 25% higher per-second rate
- Increased Cache Per Processing Node
- What it means: More data can be held in fast-access CPU cache (L1, L2, L3).
- Impact: Repeated scans of hot data (frequently accessed tables) see dramatic speedups.
- Workloads that benefit:
- BI dashboards hitting the same fact tables repeatedly
- Iterative analytics on recent data
- Real-time queries with narrow time windows
- Wider Vector Throughput
- What it means: SIMD (Single Instruction, Multiple Data) operations can process more data elements simultaneously.
- Impact: Columnar scans, Snowflake’s bread and butter – become significantly faster.
- Example: Scanning 1 billion rows to filter by date range completes 40% faster on Gen2.
- Faster DML Operations (DELETE, MERGE, UPDATE)
- What it means: Write operations leverage improved processing and memory bandwidth.
- Impact: ETL pipelines with heavy INSERT/UPDATE/DELETE operations see 50-67% runtime reductions.
- Real-world example:
MERGE INTO target_table t
USING source_table s ON t.id = s.id
WHEN MATCHED THEN UPDATE SET t.value = s.value
WHEN NOT MATCHED THEN INSERT VALUES (s.id, s.value);Gen1: 300 seconds
Gen2: 100 seconds (67% faster, 55% lower cost)
- 50% Faster Memory Bandwidth
- What it means: Improved DDR (data transfer protocol) between RAM and CPU.
- Impact: Moving data between memory and processor happens twice as fast.
- Workloads that benefit:
- Large in-memory sorts
- Hash joins with data sets that fit in RAM
- Window functions with large partition
What Didn’t Change
Critical limitation: Gen2 made almost no improvements to SSD or remote storage I/O.
Implication: Queries bottlenecked by disk I/O (especially remote spillage) won’t see meaningful speedups.

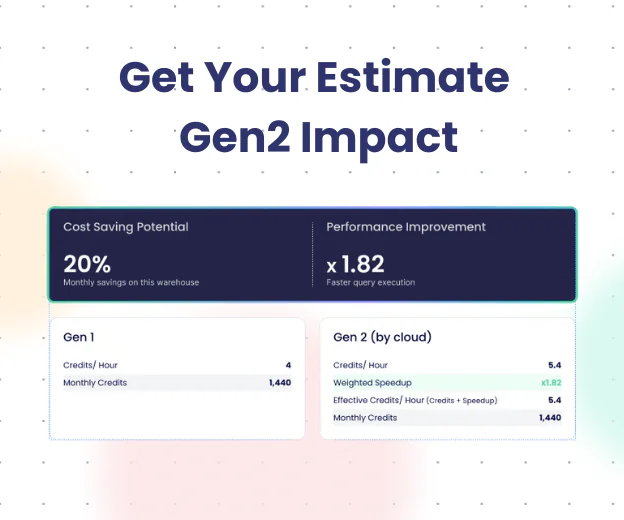
The Cost-Performance Equation
Gen2 warehouses cost 25% more per second on Azure and 35% more per second on AWS 2. The paradox: A query that runs faster can cost less if the speedup exceeds the premium.
Break-Even Analysis
For Gen2 to be cost-effective, the query must complete at least:
- Azure: 20% faster (1 ÷ 1.25 = 0.80, meaning 80% of Gen1 time)
- AWS: 26% faster (1 ÷ 1.35 = 0.74, meaning 74% of Gen1 time)
Example calculation (Azure):
Gen1 Large warehouse:
- Query duration: 100 seconds
- Cost: (100 sec ÷ 3600 sec/hour) × 8 credits = 0.222 credits
Gen2 Large warehouse (40% faster):
- Query duration: 60 seconds
- Cost: (60 sec ÷ 3600 sec/hour) × 8 credits × 1.25 = 0.167 credits
Savings: 25% lower cost despite 25% premium rate
When Gen2 doesn’t pay off:
Gen1 Large warehouse:
- Query duration: 100 seconds
- Cost: 0.222 credits
Gen2 Large warehouse (only 15% faster):
- Query duration: 85 seconds
- Cost: (85 ÷ 3600) × 8 × 1.25 = 0.236 credits
Loss: 6% higher cost
Below is the table with Query types.
| Query Type | Bottleneck | Gen2 Advantage | Speed Gain | Cost/Perf? | Explanation |
| Filtered table scans | CPU + memory bandwidth | Faster CPU + 50% RAM bandwidth | ✅ Medium–High | ✅ Yes | Large scans benefit from vectorized CPU and faster RAM fetch. |
| Joins (small in-memory) | CPU + cache | Faster CPU + 2× L2 cache | ✅ High | ✅ Yes | Small joins fit in cache and compute. |
| Joins (medium in-memory) | RAM BW + cache | CPU + RAM BW + 2× cache | ⚠️ Medium | ⚠️ Mixed | Benefits vary depending on joint size and memory behavior. |
| Joins (large in-memory) | RAM capacity | No RAM size gain | ⚠️ Small | ❌ No | Heavy joins may not improve due to unchanged RAM size. |
| Joins (with spill) | Disk / SSD | No disk improvement | ⚠️ Small | ❌ No | SSD performance unchanged. |
| CTEs, nested queries | RAM BW + CPU | CPU + RAM BW + cache | ⚠️ Medium | ⚠️ Mixed | Logical CTEs benefit, but RAM-heavy ones may not. |
| Wide-table SELECTs | RAM BW + CPU | RAM BW + CPU | ⚠️ Medium | ⚠️ Mixed | Gen2 helps if RAM BW is the issue, not RAM size or spill. |
| Update / Delete / Merge | Disk I/O + CPU | DML engine optimized + CPU | ✅ Very High | ✅ Often | Optimized execution and CPU gains boost DML Operations (DELETE, MERGE, UPDATE) speed. |
| Write-heavy inserts | Disk I/O | No SSD gain | ⚠️ Small | ❌ No | The disk remains a bottleneck – no real improvement. |
| Insert‑select | CPU + RAM + disk | CPU, RAM BW, cache (not SSD) | ⚠️ Medium | ⚠️ Mixed | SELECT benefits, but the write path may be RAM/SSD-limited. |
| Materialized views | CPU + cache | CPU + cache | ✅ High | ✅ Yes | Pre-aggregated results are CPU/cache-bound. |
| Window functions | CPU + RAM BW | CPU + RAM BW + cache | ✅ Medium | ✅ Yes | Sort/partition logic benefits from Gen2 speed. |
| Sorting large datasets | RAM or disk | CPU + RAM BW | ⚠️ Medium | ⚠️ Mixed | Helps if in-RAM; no gain if spilling to disk. |
| Large subqueries with temp tables | Disk I/O | No disk gain | ⚠️ Small | ❌ No | Disk-bound |
| UDFs / JSON parsing | CPU-heavy | Faster CPU + higher IPC | ✅ Medium–High | ✅ Yes | CPU bound logic runs faster on Gen2. |
| Concurrency-heavy | Scheduler pressure | Per-core strength + cache | ✅ Medium | ✅ Yes | Handles more users efficiently. |
| Queries with spill | Disk I/O | No SSD gain | ⚠️ Small | ❌ No | No SSD boost in Gen2. |
Query Classification Framework
Not all queries benefit equally from Gen2. Here’s how to categorize your workload.
Category 1: Clear Winners (Migrate to Gen2)
Characteristics:
- Compute-intensive (aggregations, filters, transformations)
- Minimal or no disk spillage
- Scan large volumes of data with narrow filters
- Heavy DML operations (MERGE, DELETE, UPDATE)
Query patterns:
- Simple aggregations:
SELECT
DATE_TRUNC(‘month’, order_date) AS month,
COUNT(*) AS order_count,
SUM(revenue) AS total_revenue
FROM orders
WHERE order_date >= ‘2024-01-01’
GROUP BY month;
- Filtered table scans:
SELECT * FROM clickstream_events
WHERE event_date = CURRENT_DATE
AND user_country = ‘US’; - DML-heavy ETL:
DELETE FROM staging_table WHERE processed = TRUE;
INSERT INTO fact_table SELECT * FROM staging_table;
Expected improvement: 40-60% faster, 20-45% cost reduction
Category 2: No Benefit (Stay on Gen1)
Characteristics:
- Memory-bound with remote spillage (S3/cloud storage)
- Complex multi-table joins exceeding available RAM
- Queries where I/O time dominates execution
Query patterns:
- Large joins with spillage:
SELECT *
FROM large_fact_table f
JOIN dimension_1 d1 ON f.dim1_id = d1.id
JOIN dimension_2 d2 ON f.dim2_id = d2.id
JOIN dimension_3 d3 ON f.dim3_id = d3.id— If this spills to remote storage, Gen2 provides <10% speedup - Subqueries with massive temp tables:
WITH large_intermediate AS (
SELECT * FROM huge_table_1
JOIN huge_table_2 USING (key)
— Temp result: 500 GB, exceeds warehouse memory
)
SELECT * FROM large_intermediate
WHERE condition = TRUE;
Why Gen2 doesn’t help: The bottleneck is moving data between remote storage and a compute. From HDD into I/O.
Expected improvement: <10% faster, 10-15% higher cost
Action: Fix the query instead—add clustering keys, reduce data volume, or materialize intermediate results.
Category 3: Maybe (Test Before Migrating)
Characteristics:
- Medium-sized joins (data fits in RAM or spills only to local SSD)
- Sorting large datasets
- Mixed workloads with both compute and I/O operations
Query patterns:
- Medium joins:
SELECT
c.customer_name,
SUM(o.order_value) AS total_spent
FROM customers c
JOIN orders o ON c.customer_id = o.customer_id
WHERE o.order_date >= ‘2025-01-01’
GROUP BY c.customer_name
ORDER BY total_spent DESC; - Large sorts:
SELECT *
FROM transactions
ORDER BY transaction_date DESC, customer_id
LIMIT 10000;
Decision metric: Calculate the processing-to-local-disk ratio.
Key Takeaways
- Gen2 delivers 30-60% speedups for compute-intensive queries through improved CPU, cache, and memory bandwidth
- Gen2 costs 25-35% more per second, so queries must run fast enough to offset the premium
- Break-even threshold: 20-26% faster execution (depending on cloud provider)
- Three query categories:
- Clear winners: Aggregations, filters, DML → Migrate
- No benefit: Remote spillage, I/O-bound → Stay Gen1
- Maybe: Use processing-to-disk ratio to decide
- Processing ratio > 70% → Gen2 likely pays off
- Fix queries before throwing Gen2 at them—clustering keys and query optimization often deliver better ROI than hardware upgrades
What’s Next?
Understanding Gen1 vs Gen2 is one piece of warehouse optimization. To build a complete cost-control strategy:
Continue reading:
- Scale-up vs. scale-out warehouse decisions
- The truth about Snowflake query costs
- Query tuning fundamentals
Take action:
- Audit your workload using the classification query above
- Identify top 10 most expensive queries
- Test Gen2 on “clear winner” queries for one week
- Calculate ROI and migrate if cost-effective
Seemore Data’s Smart Pulse feature automatically identifies which warehouses benefit from Gen2, tests configurations, and recommends optimal sizing—saving teams weeks of manual analysis. Start your free trial →