

In short: Snowflake bills a standard warehouse for every second it runs, with a 60-second minimum each time it starts. It does not bill per query. So the real cost of a query depends on what else ran beside it and on how long the warehouse sat idle before it suspended. Multiplying a query’s runtime by the warehouse’s hourly rate misses both. A fairer method shares each stretch of warehouse uptime, idle time included, between the queries that ran in it. To lower the cost, cut idle time first, then right-size the warehouse, then tune the heaviest queries.
Snowflake scales well, but its cost often feels like a black box. Many teams rely on simple query cost estimates that do not match how Snowflake actually bills. This post breaks down what drives cost per query, shows a more accurate way to calculate it, and ends with the changes that lower it.
Decoding Snowflake cost per query
A Snowflake bill has several parts: virtual warehouse compute, storage, cloud services (billed only for the part above 10% of the day’s warehouse credits), serverless features, data transfer and AI services. Cost per query is about the first one, warehouse compute, which is where query tuning and warehouse settings make a difference. For how each part is priced, see our Snowflake pricing guide.
Compute costs: virtual warehouse size and runtime
Each step up in warehouse size doubles the credits per hour: an X-Small uses 1 credit per hour, a Small 2, a Medium 4, and so on up to 512 for a 6X-Large (standard Gen1 warehouses). In regions where Gen2 is available, new standard warehouses default to Gen2, which comes in sizes up to 4X-Large and uses 1.35 times the credits on AWS and Google Cloud and 1.25 times on Azure. Snowflake warehouse sizes and credits per hour has the full table.
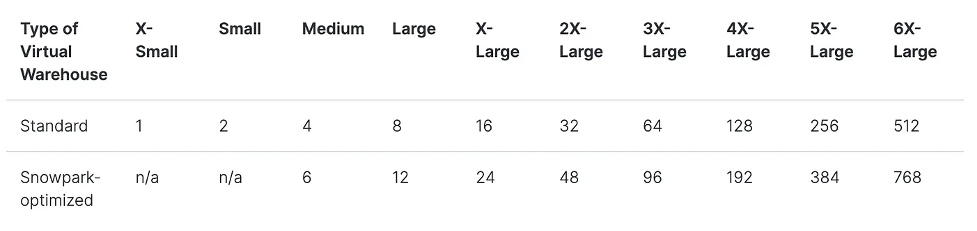
Snowflake’s sizing guidance says that, for the most part, queries scale linearly with warehouse size, particularly larger, more complex queries, and that “larger is not necessarily faster for small, basic queries.” A larger warehouse costs more per second, but if it finishes a large query in half the time, the total cost can be the same or lower. That only holds while the query can use the extra resources. Past that point you pay double for little gain. (Snowflake documentation)
Most important for cost per query: Snowflake bills a standard warehouse for the time it runs, not for the time queries run. Billing is per second, with a 60-second minimum each time the warehouse starts or resumes. A standard warehouse that is running but idle costs the same as one that is busy. (Adaptive Warehouses are the exception: they are billed per query.)
Compute costs: concurrency
Concurrency also shapes query cost. By default, a warehouse of any size, from X-Small to 6X-Large, aims to run up to 8 statements at once (the MAX_CONCURRENCY_LEVEL parameter). Snowflake describes this as a guide rather than a hard cap: small queries may run more at once, and large ones fewer. When the level is reached, a single-cluster warehouse (or a multi-cluster one in maximized mode) queues new queries, and a multi-cluster warehouse in auto-scale mode starts another cluster, which is billed while it runs. (Snowflake documentation)
You can change concurrency through MAX_CONCURRENCY_LEVEL or through the number of clusters. For example:
- With
MAX_CONCURRENCY_LEVELat 8, one active cluster runs about 8 queries at once. - With two clusters active, the warehouse can run about 16.
Snowflake notes that raising MAX_CONCURRENCY_LEVEL may leave each query with fewer resources, and recommends testing any change in small steps against your own queries. In our work with customers, raising it above 8 is uncommon and risky: setting it to 24 or 32 has caused noticeable slowdowns.
Calculating cost per query
The common shortcut, and why it is wrong
The most common way to calculate cost per query is to take the query’s runtime and multiply it by the warehouse’s hourly cost. For example, at $3 per credit (Enterprise Edition, on demand, AWS US East):
- A 1-minute query on an X-Small Gen1 warehouse (1 credit per hour) = 1/60 x $3 = $0.05
This is wrong in two ways:
- It ignores concurrency. When several queries share the warehouse, each one is charged as if it had the warehouse to itself, which on its own pushes the total above the bill.
- It ignores idle time and the minimum. A 1-second query on a suspended warehouse with
AUTO_SUSPENDset to 300 seconds keeps the warehouse running for about 5 more minutes. That is about 301 billed seconds, or roughly 300 times the shortcut’s figure. Even with a very short auto-suspend, every resume bills at least 60 seconds.
Snowflake’s own view: QUERY_ATTRIBUTION_HISTORY
Snowflake’s QUERY_ATTRIBUTION_HISTORY view gives a compute cost for each query. When queries run at the same time, it splits the warehouse cost between them by a weighted average of the resources each one used. It leaves out warehouse idle time, queries of about 100 milliseconds or less, and costs outside the warehouse (storage, data transfer, cloud services, serverless features and AI services), and it can lag by up to eight hours. Snowflake attributes credits in one-minute intervals, so short gaps between queries inside the same minute are charged to those queries; longer idle stretches are not. So the per-query costs it reports add up to less than the warehouse bill, and the gap is mostly idle time. (Snowflake documentation)
Our guide to cost per query attribution shows how to query the view and how to tag queries so costs roll up to teams, dbt models and dashboards.
A method that adds up to the bill
Because Snowflake bills warehouse uptime, a cost-per-query method that adds up to the bill has to share out that uptime, idle time included. This is how we do it at Seemore:
- Treat each period of warehouse uptime, from start to suspend, as one event.
- Group all the queries that ran during that uptime.
- Add up their run times.
- Give each query its share of that total.
- Multiply each share by the total uptime to get a “normalized runtime”.
- Multiply the normalized runtime by the warehouse’s cost per second to get the “normalized cost per query”.
Concurrent queries share the time they overlap, and the idle time is shared out too, so the query costs add up to the warehouse cost. It shares time by duration, not by resources, so read it alongside Snowflake’s view: the view shows which queries are heaviest, and this method shows what idle time adds to each.
A worked example
A Small Gen1 warehouse (2 credits per hour at $3 per credit, so $6 per hour, or about $0.00167 per second) with AUTO_SUSPEND set to 60 seconds resumes and runs four queries. They overlap, so together they keep the warehouse busy for one unbroken stretch of 40 seconds. The warehouse then sits idle for about 60 seconds until it auto-suspends. It ran for 100 seconds in total, and that is what Snowflake bills.
| Query | Run time | Share of 44 s | Normalized runtime (share x 100 s) | Normalized cost |
|---|---|---|---|---|
| Q1 | 10 s | 22.7% | 22.7 s | $0.038 |
| Q2 | 24 s | 54.5% | 54.5 s | $0.091 |
| Q3 | 4 s | 9.1% | 9.1 s | $0.015 |
| Q4 | 6 s | 13.6% | 13.6 s | $0.023 |
| Total | 44 s | 100% | 100 s | $0.167 |
Check: 100 seconds x $0.00167 = $0.167, the same as the sum of the four query costs.
The shortcut would have priced the four queries at 44 seconds in total, or $0.073, less than half of what the warehouse actually cost. Snowflake’s view would attribute only the 40 busy seconds, about $0.067, and leave the 60 idle seconds, about $0.100, unassigned. In this example most of the cost is idle time, which is exactly what the next section goes after.
How to lower Snowflake query costs
- Cut idle time first.
CREATE WAREHOUSEsetsAUTO_SUSPENDto 600 seconds unless you set it, so a warehouse can bill up to 10 minutes after its last query. Lower it on warehouses with long gaps between queries. On warehouses with frequent short queries, weigh it against the 60-second minimum on every resume and the cache that is lost on suspend. Our guide to Snowflake auto-suspend covers the tradeoff and the right setting. - Right-size the warehouse. Run the heaviest queries one size up and one size down, and compare total cost (runtime x credits per second), not runtime alone.
- Group workloads. A few busy warehouses idle less than many lightly used ones.
- Check multi-cluster settings. Review the minimum and maximum cluster counts and the scaling policy. A warehouse only suspends once it is down to its minimum number of clusters, so a high minimum keeps extra clusters running after the peak has passed.
- Tune the heaviest queries. Use
QUERY_ATTRIBUTION_HISTORYto find the queries that cost the most, then look at pruning, spilling and repeated work.
If the bill jumped and you do not know why, start with why your Snowflake bill doubled. For the mistakes that survive most cost reviews, see five Snowflake cost mistakes.
Why this matters
Snowflake’s pricing rewards efficient use, but only if you can see where the time goes. Simple cost-per-query estimates either inflate or understate the cost, and they hide the biggest item, which is often idle time. A method based on warehouse uptime gives a truer picture of query costs and a better base for cost control.
What to do next
If you want to lower your Snowflake spend without hurting performance, precision matters. Seemore shows the real story behind your warehouse metrics, query by query. Want to see how much you could save? Schedule a consultation with our data optimization experts today.
Frequently asked questions
Does Snowflake charge per query?
Not for standard warehouses. Snowflake bills a standard warehouse for every second it runs, with a 60-second minimum each time it starts or resumes, whether or not a query is running, so a query’s cost is a share of that warehouse time. Adaptive Warehouses are the exception: they are billed per query. Serverless features, cloud services, storage and AI services are billed separately.
Why don't the costs in QUERY_ATTRIBUTION_HISTORY add up to my warehouse bill?
The view leaves out warehouse idle time and queries of about 100 milliseconds or less, so its totals are lower than what the warehouse was billed. The difference is mostly idle time. WAREHOUSE_METERING_HISTORY shows both numbers per hour: CREDITS_USED_COMPUTE and CREDITS_ATTRIBUTED_COMPUTE_QUERIES.
What is the minimum Snowflake bills when a warehouse starts?
For a standard warehouse, 60 seconds. After that first minute, billing is per second. (Interactive warehouses have a longer, one-hour minimum.) A 5-second query on a suspended warehouse is billed as at least 60 seconds, plus any idle time before the warehouse suspends again.
What are the most common causes of wasted Snowflake compute?
Idle time before auto-suspend, warehouses larger than their queries need, extra clusters that stay up after demand drops, and repeated or poorly pruned queries. Our post on five Snowflake cost mistakes goes through the ones teams miss most often.