Why Lack of Snowflake Observability is the Real Root Cause of Cost Problems


73% of organizations misconfigure their Snowflake environments, leading to runaway costs. But here’s the uncomfortable truth: the problem isn’t the configuration, it’s that you can’t see what’s actually happening. Without real-time Snowflake observability into query patterns, warehouse utilization, and pipeline dependencies, you’re flying blind. This post breaks down why Snowflake observability is the foundation of cost control, and how modern data teams are finally solving it.
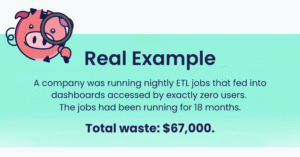
The $500K Wake-Up Call
A mid-sized fintech company discovered they were spending $42,000 per month on a single Snowflake warehouse. The warehouse ran 24/7, processing what appeared to be critical workloads.
When they finally gained visibility into what was actually running, they discovered:
- 10 metadata refresh queries running every minute
- Each query took milliseconds to execute
- The warehouse was idle 99.8% of the time
- Total waste: ~$30,000 per year
Sound familiar? Here’s how one company fixed it with a single config change.
This isn’t an isolated incident. It’s the pattern.

The Snowflake Observability Blind Spot: Why Traditional Monitoring Fails
Most data teams rely on Snowflake’s native query history and basic dashboards. The problem? These tools show you what happened, not why it matters.
What You See:
- Query execution times
- Credit consumption by warehouse
- Storage growth over time
What You’re Missing:
- Which unused tables are consuming storage and compute
- Which data flows haven’t been accessed in months but still run daily
- Query dependencies that cause cascading performance issues
- Real cost per data product, not just cost per query
- Warehouse idle time masked by auto-suspend delays
As discussed on Reddit, the Snowflake cost problem is fundamentally an observability problem that most organizations have neglected to prioritize.
The Three Snowflake Observability Gaps Killing Your Budget
1. Query-Level Visibility ≠ Pipeline-Level Understanding
You can see individual queries, but you can’t see:
- Which downstream processes depend on this table
- Whether anyone actually uses the output
- The full cost of a data product from source to BI dashboard
Learn how data lineage reveals the true cost of your data products →
2. Warehouse Metrics Without Context
Snowflake tells you warehouse utilization. It doesn’t tell you:
- Whether warehouses are sized correctly for actual workload patterns
- If queries are queuing due to undersized compute
- Whether spillage is silently degrading performance
- When to scale up vs. scale out
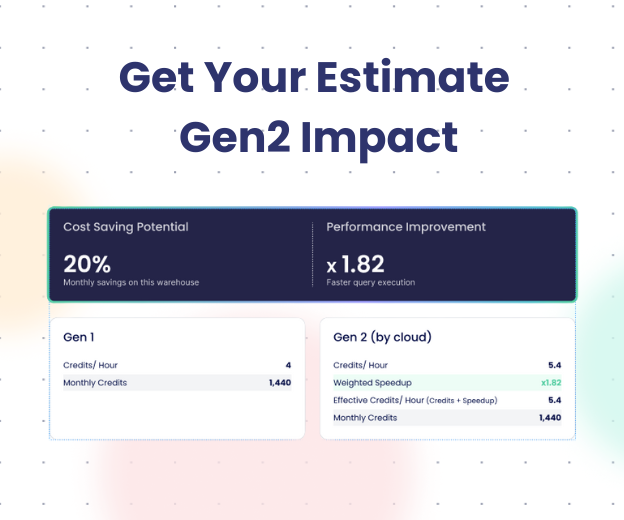
The Hidden Cost: A 2X-Large warehouse running at 40% capacity costs the same as two Large warehouses at 80% capacity—but the latter handles spikes better.
Discover the Holy Trinity of Snowflake query tuning →
3. No Connection Between Cost and Business Value
Most BI tools show:
- Cost trending up or down
- Usage by user or warehouse
They don’t show:
- Cost per business outcome (e.g., cost per customer insight)
- ROI of data products
- Which teams are driving cost spikes
- Data product efficiency trends
Without this context, you can’t answer basic questions like: “Should we optimize this pipeline or just shut it down?”
Why measuring data ROI at the data product level changes everything →
The Observability Stack Modern Data Teams Are Building
Based on conversations with data leaders at companies like Verbit, Tipalti, and Rapyd, here’s what effective observability looks like in 2025:
Layer 1: Real-Time Cost Visibility
- Credit consumption by data product, not just warehouse
- Anomaly detection that catches cost spikes before they hit your bill
- Usage-based attribution showing which teams/projects drive costs
See how real-time monitoring prevents budget overruns →
Layer 2: Deep Pipeline Lineage
- Column-level lineage from source to BI
- Impact analysis showing downstream effects of changes
- Unused asset detection identifying zombie tables and flows
Explore data lineage tools and techniques →
Layer 3: Autonomous Optimization
- AI-driven warehouse right-sizing based on actual patterns
- Automated recommendations for clustering keys, materialized views
- Proactive alerts for configuration drift
Learn about autonomous warehouse optimization →
Case Study: From Blind Spending to Controlled Growth
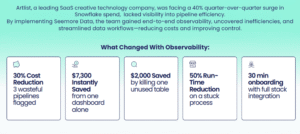
Read the full Artlist case study →
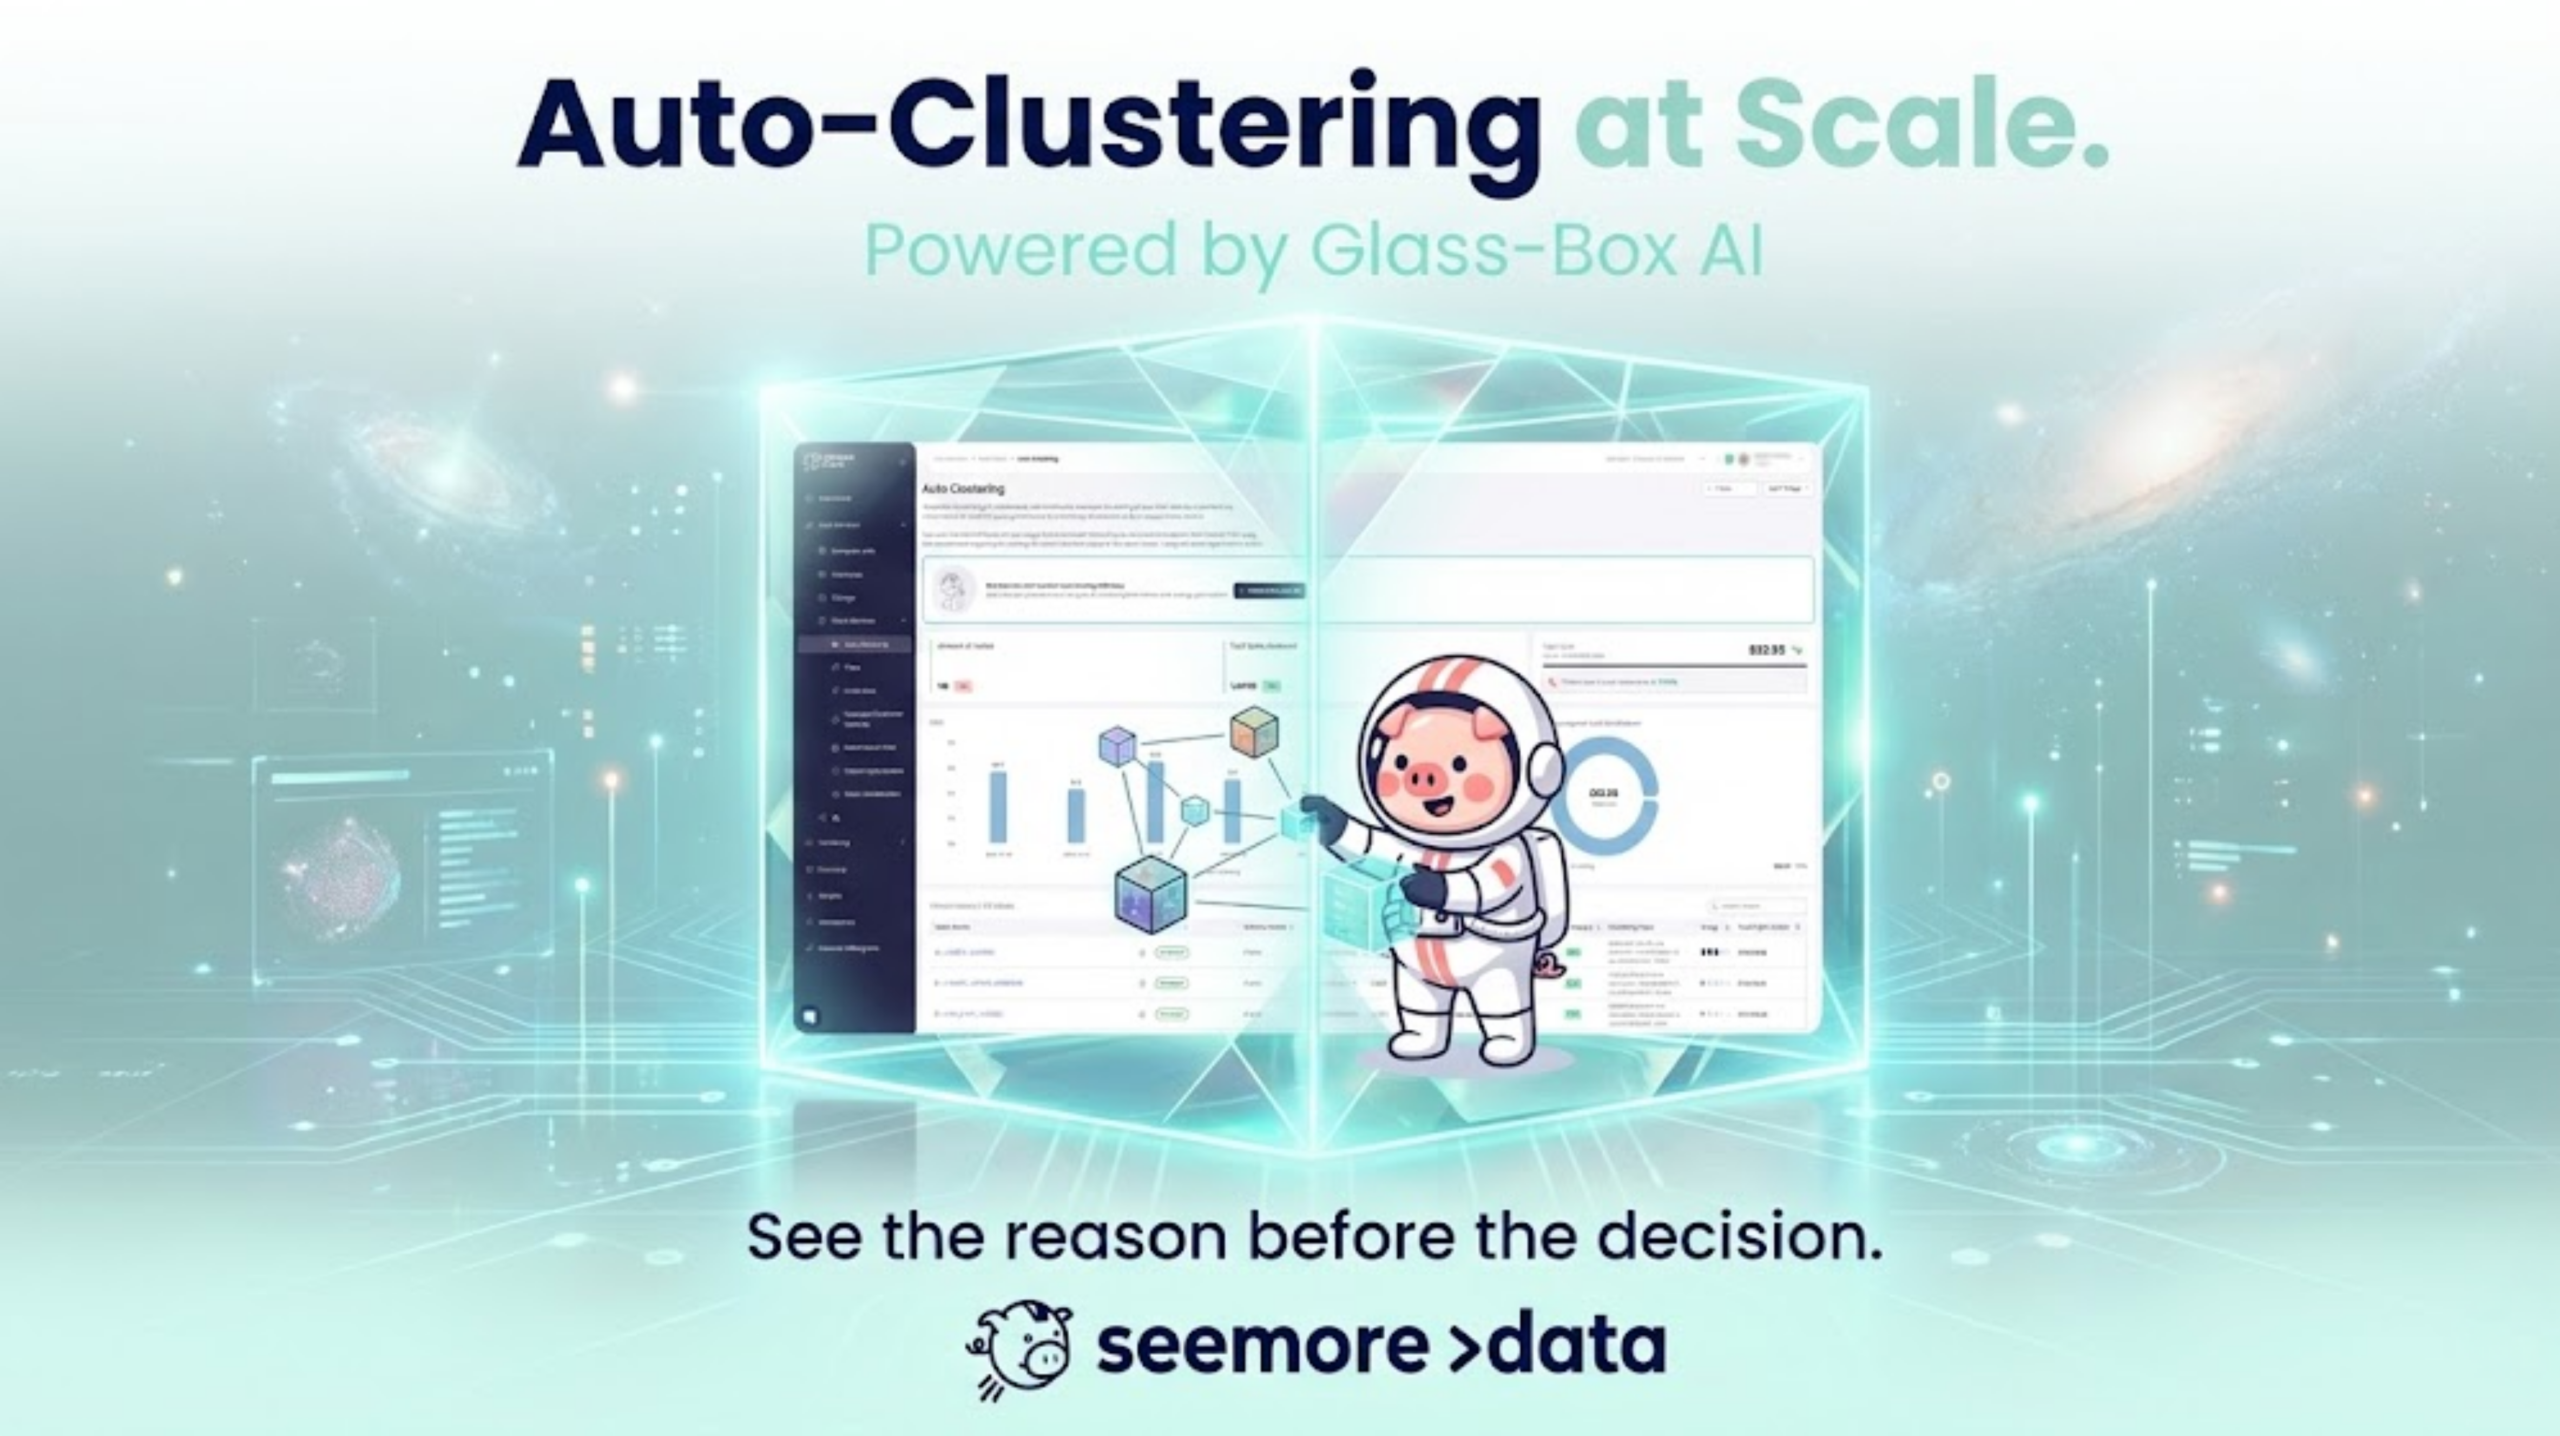
The Agentic AI Future: Snowflake Observability That Acts
The next evolution isn’t just seeing problems, it’s autonomous remediation.
AI agents are now:
- Automatically adding clustering keys when they detect scan inefficiencies
- Right-sizing warehouses hourly based on queue depth and spillage
- Identifying schema drift in upstream sources
- Creating materialized views for frequently-scanned patterns
How Smart Pulse enables hourly autonomous optimization →
How to Build Observability Into Your Stack (Without Starting Over)
- Start With Usage, Not Cost – Most teams start by trying to reduce cost. Start by understanding what’s actually being used. Eliminate waste first, optimize second.
- Instrument at the Data Product Level – Track costs, performance, and usage by business outcome, not technical metric. This aligns data teams with business priorities.
- Automate Detection, Not Just Reporting – Dashboards are reactive. Anomaly detection and proactive alerts are preventative. Catch problems before they become budget disasters.
- Connect Observability to Action – Every insight should have a clear remediation path. If your observability tool just shows problems without solutions, you’re only halfway there.
Learn about Seemore’s proactive AI agent approach →
Key Takeaways
- Observability isn’t optional—it’s the foundation of cost control
- Query metrics alone are insufficient—you need pipeline-level visibility
- Real-time detection beats monthly reviews—catch anomalies immediately
- Context matters more than data—understand why costs spike, not just when
- Automation is the endgame—AI agents can act on insights faster than humans
What’s Next?
If you’re struggling with Snowflake costs, ask yourself:
- Can you identify your top 10 most expensive data products right now?
- Do you know which tables haven’t been queried in 90 days?
- Can you trace a BI dashboard back to its source tables with full lineage?
- Do you have real-time alerts for cost anomalies?
If you answered “no” to any of these, you have an observability problem, not just a cost problem.
Start your free trial with Seemore Data and gain complete visibility into your Snowflake environment in minutes.