
TL;DR
If your team assumes that a bigger Snowflake warehouse always costs more and simply runs queries faster, you are using the wrong model.
Snowflake query behavior changes based on memory pressure, operator type, spillage, and workload overlap.
A memory-heavy query running on a small warehouse can spill to slower storage, run much longer, and cost more than the same query on a larger warehouse.
The practical approach is to monitor the right signals, such as:
- Warehouse size
- Query load percentage
- Bytes scanned
- Spillage metrics
These signals help data teams predict query behavior and implement Snowflake cost optimization strategies, not just individual query speed when Vertical scaling Snowflake.
Vertical scaling Snowflake: What it means increasing your Warehouse size
Each warehouse tier increases:
- Compute resources
- Available memory
- Parallel processing capacity
Many teams assume this creates a simple trade-off:
More power → higher cost
Real query behavior is more complex.
Queries typically follow one of four patterns when scaling warehouses:
- Linear improvement
Runtime decreases steadily as compute increases. - Diminishing returns
Performance improves initially, then levels off. - Performance plateau
Additional computing produces minimal improvement. - Cost reduction through scaling
Runtime drops enough that the total cost decreases.
The fourth pattern occurs when queries become memory-bound.
When additional memory prevents remote spillage, the runtime can drop dramatically.
In short:
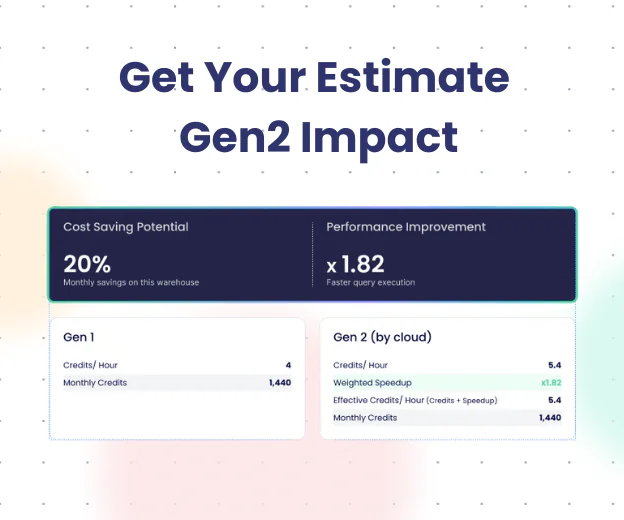
A larger Snowflake warehouse can sometimes reduce both runtime and total cost.
Three KPIs That Predict Snowflake Query Behavior
Cost per query is a lagging metric.
Three signals provide stronger predictive insight into query behavior.
Warehouse Size
Warehouse size determines the maximum compute and memory available for query execution and is a key component of Snowflake warehouse performance optimization.
This affects:
- Parallel processing capacity
- Query memory limits
- Intermediate data processing
Warehouse sizing, therefore, directly influences query memory usage and spill risk.
Query Load Percentage
Query load percentage indicates warehouse concurrency pressure.
High load typically signals:
- Queued queries
- Resource contention
- Reduced performance
This metric helps distinguish between:
- Scaling problems – warehouse too small
- Concurrency problems – warehouse overloaded
Bytes Scanned
Bytes scanned measures how much data a query reads.
It does not equal memory usage, but it strongly correlates with:
- Data movement
- Processing workload
- Potential memory pressure
When paired with query operator type, bytes scanned becomes a useful proxy for predicting memory demand.
In short:
Warehouse size, query load percentage, and bytes scanned together explain most Snowflake query performance behavior.
Why Bytes Scanned Matter for Snowflake Query Optimization
Most teams treat bytes scanned as a simple measure of data access, but it becomes far more useful when analyzed as part of usage-based data pipeline optimization, where query behavior is tied to actual workload demand.
The more useful interpretation is how it relates to memory demand.
Snowflake exposes bytes scanned through query history tables.
SELECT
query_id,
warehouse_name,
total_elapsed_time / 1000 AS elapsed_seconds,
bytes_scanned,
rows_produced,
query_text
FROM snowflake.account_usage.query_history
WHERE start_time >= DATEADD(day, -7, CURRENT_TIMESTAMP())
AND warehouse_name IS NOT NULL
ORDER BY bytes_scanned DESC
LIMIT 25;
Queries scanning large datasets often place heavy pressure on memory.
However, the query operator shape significantly affects how memory demand grows.
Typical patterns include:
Filter-heavy queries
- Low memory amplification
- Data filtered early in execution
Aggregation-heavy queries
- Moderate working memory requirements
Join-heavy queries
- Large intermediate datasets
Window-function queries
- High memory amplification due to partition processing
Two queries scanning identical data volumes can behave very differently.
Example:
- Query A scans 200 GB and filters most rows early.
- Query B scans 200 GB but performs large window operations.
Both have identical bytes scanned.
Only one is likely to become memory-bound.
In short:
Bytes scanned become far more useful when combined with query operator patterns.
Snowflake Spillage: The Hidden Driver of Query Runtime

Spillage occurs when Snowflake cannot keep intermediate data in memory.
Data moves through a storage hierarchy:
- Memory
- Local SSD
- Remote storage
Each step increases latency.
Remote storage introduces the largest performance penalty.
When queries spill remotely, runtime can increase by multiples, not just percentages.
This explains why warehouse size can sometimes reduce cost when organizations apply warehouse optimization techniques that identify memory pressure and remote spillage.
A larger warehouse provides more memory.
If that memory eliminates remote spillage, the query may finish dramatically faster.
Snowflake exposes spillage metrics through query history.
SELECT
query_id,
warehouse_name,
bytes_scanned,
bytes_spilled_to_local_storage,
bytes_spilled_to_remote_storage,
total_elapsed_time / 1000 AS elapsed_seconds
FROM snowflake.account_usage.query_history
WHERE start_time >= DATEADD(day, -7, CURRENT_TIMESTAMP())
AND bytes_spilled_to_remote_storage > 0
ORDER BY bytes_spilled_to_remote_storage DESC
LIMIT 50;
Queries with heavy remote spillage are strong candidates for vertical scaling tests.
In short:
Remote spillage is often the largest contributor to slow Snowflake queries.
Snowflake Warehouse Sizing: Why Smaller Warehouses Are Not Always Cheaper
A memory-heavy query illustrates why smaller warehouses are not always optimal.
Consider the following pattern.
Small warehouse
- Heavy remote spillage
- Long runtime
- High total cost
Medium warehouse
- Reduced spillage
- Moderate runtime improvement
Large warehouse
- Minimal spillage
- Short runtime
- Potentially lower cost
The goal is not to find the smallest warehouse.
The goal is to find the configuration where:
- Remote spillage disappears
- Parallel processing still provides a benefit
Beyond that point, scaling only increases price.
In short:
Optimal Snowflake warehouse sizing eliminates remote spillage without unnecessary compute.

Workload Behavior Matters More Than Individual Queries
Snowflake bills based on warehouse uptime, not query complexity. This is why teams increasingly rely on usage-based workload optimization to reduce idle compute and unnecessary warehouse runtime.
This means workload behavior determines cost more than individual queries.
Many queries run simultaneously and compete for the same resources.
The queries that matter most are those that extend warehouse runtime.
A workload-level view can be generated using query history.
SELECT
warehouse_name,
DATE_TRUNC(‘hour’, start_time) AS hour_bucket,
COUNT(*) AS query_count,
AVG(total_elapsed_time / 1000) AS avg_elapsed_seconds,
SUM(bytes_scanned) AS total_bytes_scanned
FROM snowflake.account_usage.query_history
WHERE start_time >= DATEADD(day, -7, CURRENT_TIMESTAMP())
GROUP BY 1, 2
ORDER BY 2 DESC, 5 DESC;
This analysis highlights:
- Concurrency peaks
- Workload bursts
- Queries extending warehouse uptime
In short:
Optimizing the queries that extend warehouse runtime produces the largest cost improvements.
Predicting Query Behavior for Snowflake Compute Cost Optimization
When teams apply continuous Snowflake cost monitoring that correlates query behavior with warehouse runtime.
A structured workflow produces useful guidance.
Step 1: Identify dominant query patterns
Group queries by operator type:
- Filters
- Aggregations
- Joins
- Window functions
Queries with joins and window functions often become memory-bound.
Step 2: Measure key workload signals
Track three metrics per warehouse:
- Warehouse size
- Query load percentage
- Bytes scanned
These signals distinguish concurrency pressure from memory pressure.
Step 3: Identify memory-bound queries
Look for queries that combine:
- Large scan volumes
- Complex operators
These queries are likely candidates for vertical scaling tests.
Step 4: Detect spillage patterns
Review spillage metrics:
-
bytes_spilled_to_local_storage
-
bytes_spilled_to_remote_storage
Frequent remote spillage indicates insufficient memory.
Step 5: Test warehouse sizes against the workload
Run the same workload across different warehouse sizes.
Measure:
- Runtime changes
- Spillage reduction
- Total warehouse uptime
The optimal configuration usually occurs where remote spillage disappears, and the runtime drops significantly.
In short:
Snowflake compute cost optimization works best when evaluating entire workloads instead of single queries.
Where Seemore Fits
Building workload-level optimization models internally is possible.
It is also complex.
Teams must continuously correlate:
- Query performance
- Warehouse configuration
- Cost patterns
- Data pipeline activity
Seemore Data addresses this challenge by analyzing cost, performance, and usage signals across the entire data stack through an AI-driven data efficiency agent that continuously detects optimization opportunities.
The platform continuously evaluates:
- Snowflake warehouse performance
- Query behavior and spillage
- Pipeline usage patterns
- BI workload impact
It then surfaces optimization opportunities and automates actions such as scheduling adjustments, workload-aware scaling, and cost anomaly detection.
In short:
Seemore turns warehouse tuning from manual analysis into continuous optimization.
Vertical scaling Snowflake often behaves differently from team expectations.
Key principles include:
- Larger warehouses do not always cost more
- Smaller warehouses do not always save money
- Bytes scanned help estimate memory pressure
- Remote spillage is a major driver of runtime
- Workload behavior determines total warehouse cost
Teams that monitor these signals can predict query behavior more accurately.
Once the correct model is applied, warehouse tuning becomes predictable rather than guesswork.
FAQ
What is vertical scaling in Snowflake?
Vertical scaling means increasing or decreasing warehouse size so queries receive more or less compute and memory.
Why can a larger Snowflake warehouse cost less?
A larger warehouse can eliminate remote spillage, reducing runtime enough to lower total warehouse compute time.
Which Snowflake metrics predict query behavior?
Warehouse size, query load percentage, bytes scanned, and spillage metrics are the most useful indicators.
Why are the bytes scanned difficult to interpret?
Bytes scanned do not directly represent memory usage. It must be combined with the query operator type to estimate memory pressure.
Is all Snowflake spillage bad?
No. Some local spillage is acceptable. Remote spillage usually creates the largest performance penalty.
Should teams optimize queries or workloads?
Workloads. Snowflake bills based on warehouse uptime, so the queries extending warehouse runtime provide the largest optimization opportunities.