
Snowflake is fast out of the box but not auto-magical. If you’re seeing dashboards creep past SLA, warehouses pinned at 100%, or credit burn that makes finance flinch, you don’t need folklore…you need a method. Here’s a concise, field tested playbook to diagnose and fix query slowness with minimal hand waving and maximum impact, basically…we’re gonna start treating performance as a product.
1. Find the bottleneck before touching the warehouse
Open Query Profile for the slow statement and read it like a radiologist: which node dominates time TableScan, Sort, Join, or Aggregate? Check Most Expensive Nodes, Partitions scanned vs total, and Bytes spilled to local/remote. Then corroborate trends in SNOWFLAKE.ACCOUNT_USAGE.QUERY_HISTORY (e.g., top offenders, repeat offenders via query_hash). Use Snowsight for quick triage, then formalize with ACCOUNT_USAGE dashboards. Snowflake Docs
Quick probe (spills are your enemy):
sql
SELECT query_id, total_elapsed_time
bytes_spilled_to_local_storage,
bytes_spilled_to_remote_storage
FROM SNOWFLAKE.ACCOUNT_USAGE.QUERY_HISTORY
WHERE start_time >= DATEADD(day,-1,CURRENT_TIMESTAMP())
ORDER BY bytes_spilled_to_remote_storage DESC
LIMIT 50;
For even deeper analysis into query bottlenecks, see our Query Insights: More Signal, Less Guesswork guide

2. Reduce what you read: pruning > horsepower
Snowflake stores tables as columnar micro-partitions. Great performance comes from partition pruning. If a Table Scan is hot, ask: can we read less?
Pick clustering keys deliberately
- Cluster large tables (think thousands of micro-partitions) on high cardinality columns that appear in WHERE/JOIN/GROUP BY (dates, IDs).
- Avoid clustering tiny or heavily updated tables maintenance can outweigh benefits.
Remember: clustering is not for every table; it costs credits both to build and maintain. Estimate the impact first:
SELECT
SYSTEM$ESTIMATE_AUTOMATIC_CLUSTERING_COSTS(‘MY_DB.MY_SCHEMA.ORDERS’);
- And review when clustering is appropriate in the docs. Snowflake Docs
Tip: Don’t sabotage pruning. Avoid wrapping filter columns in functions (TO_CHAR(order_date, …)) compare directly on the native type.
When clustering isn’t the right tool
For “needle in a haystack” point lookup (equality/IN, substrings, some geospatial), use Search Optimization Service at table/column level:
ALTER TABLE EVENTS
ADD SEARCH OPTIMIZATION ON EQUALITY(user_id), SUBSTRING(url_path);
Search Optimization Service builds a persistent search structure that drastically reduces partitions scanned for selective predicates (Enterprise Edition). Choose the right method: EQUALITY, SUBSTRING, or GEO. Snowflake Docs
Precompute what’s expensive
Common aggregations feeding BI? Create materialized views or derived tables; let background maintenance do the heavy lifting and keep interactive queries lean.
3. Make processing cheaper: design for memory, avoid explosions
If Sort/Aggregate dominates and you see spills either reduce rows/columns earlier or make the work partition-friendly (window functions with PARTITION BY, smaller GROUP BY cardinality, remove unnecessary ORDER BY).
Beware OR in joins (often explodes)
Split into two selective joins and combine. Here’s a clean drop in section you can copy:
SELECT
l.l_orderkey,
l.l_partkey,
l.l_suppkey,
ps.ps_availqty
FROM lineitem AS l
JOIN partsupp AS ps
ON (l.l_partkey = ps.ps_partkey OR l.l_suppkey = ps.ps_suppkey);
— Rewrite: UNION (deduplicates by default), typically much faster
SELECT
l.l_orderkey,
l.l_partkey,
l.l_suppkey,
ps.ps_availqty
FROM lineitem AS l
JOIN partsupp AS p
ON l.l_partkey = ps.ps_partkey
UNION
SELECT
l.l_orderkey,
l.l_partkey,
l.l_suppkey,
ps.ps_availqty
FROM lineitem AS l
JOIN partsupp AS ps
ON l.l_suppkey = ps.ps_suppkey;
Why it works: each branch stays selective, enabling better join strategies and partition pruning. The single OR clause often forces a massive join expansion followed by a filter.
Other quick wins:
- Avoid wrapping filter columns in functions (TO_CHAR(order_date,…)) you’ll kill pruning.
- Prefer window functions over self joins for ranks/gaps.Measure GROUP BY cardinality with APPROX_COUNT_DISTINCT before grouping on a billion keys.
Hint: In most queries you can map (to an extent) bytes scanned to memory usage.
4. Scale compute intelligently: isolate, right-size, and burst
Vertical vs horizontal scaling
- Vertical (bigger warehouse) helps big sorts/joins and reduces spilling (more RAM and local SSD).
Horizontal (multi-cluster) kills queueing bursts without over-provisioning one giant box. Configure min/max clusters and a scaling policy:
ALTER WAREHOUSE ANALYTICS_WH
SET MIN_CLUSTER_COUNT = 1,
MAX_CLUSTER_COUNT = 3,
SCALING_POLICY = STANDARD; — or ECONOMY for batch
- STANDARD minimizes queueing; ECONOMY favors full clusters and lower spend for batchy work. Snowflake Docs
Use Query Acceleration Service surgically
Query Acceleration Service offloads portions of heavy queries to a serverless pool, speeding up large scans/sorts without upsizing the warehouse. It’s fantastic for the occasional monster but watch spend; pair with timeouts/resource monitors.
ALTER WAREHOUSE ANALYTICS_WH SET ENABLE_QUERY_ACCELERATION = TRUE;
Read the docs for behaviors and guardrails before enabling broadly. Snowflake Docs
Cache trade-offs
Short auto-suspend saves credits but resets local cache, making the first query cold. Longer suspend retains cache at the cost of idle minutes. Tune per workload (adhoc vs. steady dashboards).
P.S. Seemore data optimizes autosuspend automatically so no worries there.
5. Institutionalize feedback loops
Treat performance as a product:
- Scorecards: Track pruning ratio (partitions scanned/total), spill bytes, p90/p95 runtime by model/report.
- Repeat offenders: Group by query_hash to identify queries that are “cheap per run, expensive in aggregate.”
- Warehouse health: Correlate queueing with cluster count and scaling policy adjustments over time.
Example- find long-running repeats by parameterized hash:
SELECT query_parameterized_hash, COUNT(*) AS runs,
SUM(total_elapsed_time)/1000 AS secs
FROM SNOWFLAKE.ACCOUNT_USAGE.QUERY_HISTORY
WHERE start_time >= DATEADD(day,-7,CURRENT_TIMESTAMP())
GROUP BY 1
ORDER BY secs DESC
LIMIT 50;
(See the QUERY_HISTORY schema docs for column definitions and latency notes.) Snowflake Docs
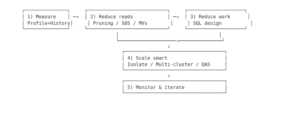
The model methodology
Snowflake will dutifully run whatever you ask of it even wildly inefficient plans, sooo performance is on you! Here’s how you can take control over your queries:
- Measure (Profile + History)
- Reduce reads (pruning/SOS/MVs)
- Reduce work (SQL design)
- Scale smart (isolate, multi-cluster, QAS)
- Monitor & iterate.
The craft is to make every query read less (via partition pruning, sensible clustering, SOS, and pre-aggregations), sort less (project narrowly, filter early, prefer window functions over self-joins, avoid OR joins), and queue less (isolate workloads, right-size warehouses, use multi-cluster/QAS when bursts hit). Treat this like an engineering loop: profile the plan, inspect QUERY_HISTORY, watch spill bytes and pruning ratios, and track p95/p99 latencies by model.
When you change something, prove the gain with numbers fewer partitions scanned, lower spill, shorter critical path then lock it in. Rinse, repeat, and let the credits you don’t spend be your scoreboard.
Want to see exactly where your queries are burning credits – and how to fix it? Book a demo with a Seemore data efficiency expert today.