Drive optimization from your lineage & get real-time cost precision.
What is the Daily Price Tag of a Single Fivetran Connector?
This is one of the most common questions data teams face when using Fivetran. Unfortunately, the answer isn’t straightforward. While Fivetran pricing is based on Monthly Active Rows (MAR), understanding the daily cost of a single connector is anything but simple.
Why Is Fivetran Pricing Complicated?
Fivetran’s consumption-based model revolves around Monthly Active Rows (MAR), charging customers based on the number of unique rows processed within a month across all connectors. Yet, tracking MAR by connector, per day, is far from transparent. This complexity arises due to:
- Sync frequency variations across connectors
- Varying source activity patterns
- Dynamic data changes triggering MAR counts unpredictably
- Visibility gaps in Fivetran’s native estimators and dashboards
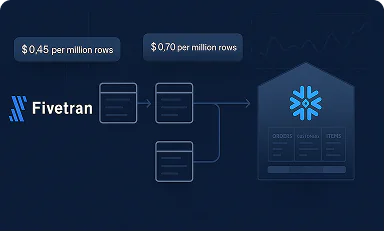
Customers may see charges from two Fivetran pricing models: (1) legacy account-level MAR, where usage from every connector accrues into a single volume pool; and (2) the newer connector-level MAR consumption model, where usage (and cost) is tracked per connector. However, environments that include both require you to apportion pooled MAR, align discount tiers, and stitch together periods, which significantly complicates cost accuracy.
What is MAR?
Monthly Active Rows (MAR) refers to the total number of unique rows processed in a month. This metric is influenced by:
- Sync schedules (frequency drives row count)
- Source changes (even minor updates can trigger row activity)
- Number of active connectors
Since MAR resets monthly, predicting daily costs or analyzing spikes mid-month is complicated using standard Fivetran tools.
What is a Log Connector?
Fivetran’s Log Connector provides access to usage metadata from your Fivetran account, including sync history, connector activity, and MAR consumption metrics. When used effectively, this connector unlocks deeper visibility into pipeline activity.
However, interpreting log data and correlating it to actual costs remains a technical challenge, requiring manual analysis and expertise that many teams lack.
The Two Main Challenges of Optimizing Fivetran Costs
1. Get Detailed Costs Per Connector, Per Day
Teams want to know: “How much is this specific connector costing me, right now?” Yet, achieving this level of granularity is difficult due to:
- Limited cost breakdown across connectors
- Difficulty reconciling between legacy and MAR-based pricing models
- Complexities of understanding each pricing tier within MAR billing
- Raw Log Connector data being hard to translate into financial insights
While the Fivetran Log Connector exposes the necessary metadata, transforming that raw data into accurate daily cost per connector remains a manual, error-prone task.
2. See the Big Picture: From Source to BI
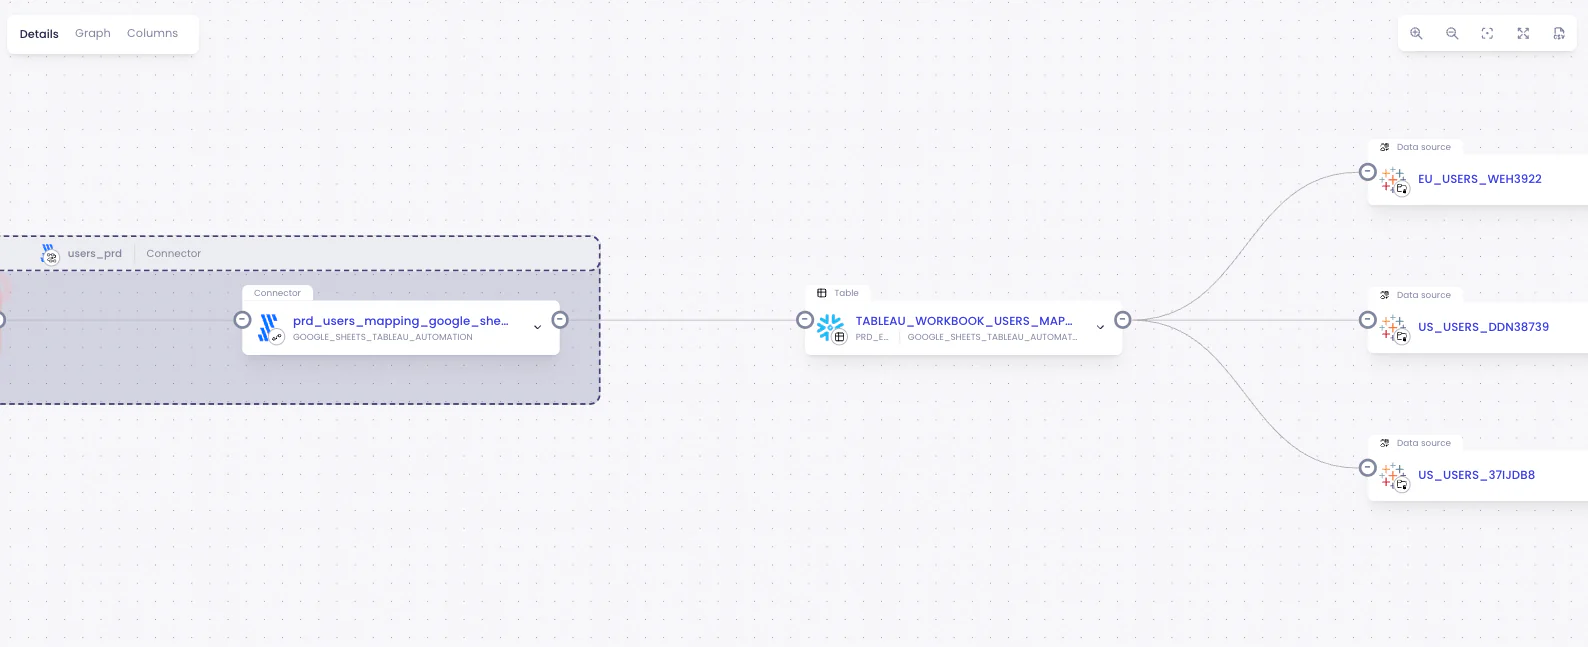
Fivetran connectors are only part of the modern data pipeline. Once data is ingested, it flows into warehouses like Snowflake, undergoes transformations, and is finally consumed in BI tools. Without visibility into this full data journey, optimizing just the connector stage misses the bigger picture.
To truly optimize costs and performance, teams need:
- End-to-end data flow visualization from source to BI
- Understanding of how Fivetran activity impacts downstream workloads
- The ability to analyze each pipeline component, including ingestion, transformation, and reporting layers
- Real-time insights to monitor and optimize holistically
See every Cost, Map the full lineage, Optimize your stack

Seemore Data uses the Fivetran Log Connector as a foundation to simplify and automate ETL cost tracking. By connecting directly to log metadata, Seemore transforms raw sync activity into real-time, actionable insights via its AI-powered platform.
With Seemore Data, you can:
- Track Cost Per Connector, Per Day: Seemore analyzes Log Connector data and correlates sync activity to actual MAR costs, broken down daily and by connector.
- Support Both Pricing Models: Seemore intelligently interprets both legacy and MAR-based pricing structures, providing clarity no matter your billing model.
- Understand Pricing Tiers: Our platform demystifies MAR billing tiers and thresholds, alerting teams when approaching higher-cost thresholds.
- Visualize the Entire Data Flow: Seemore maps the full lineage from source to BI, connecting Fivetran activity to downstream Snowflake and analytics workloads.
- Identify Optimization Opportunities Holistically: By understanding how each component in the pipeline contributes to cost and performance, Seemore enables real-time optimization suggestions across your stack.
See the Full Lineage: holistic view of the data flow from source to BI
Conclusion
While Fivetran’s Log Connector and native tools provide some visibility, accurately tracking daily costs per connector and understanding Fivetran’s role in your broader data flow remains complex.
Seemore Data addresses this challenge by transforming raw metadata into meaningful insights, giving data teams:
- Detailed daily cost analysis
- Clear understanding of MAR pricing tiers
- Holistic view of the data flow from source to BI
- Real-time, actionable optimization insights
With Seemore’s AI-powered agent working alongside your Fivetran pipelines, ETL cost control becomes simple, precise, and continuous.