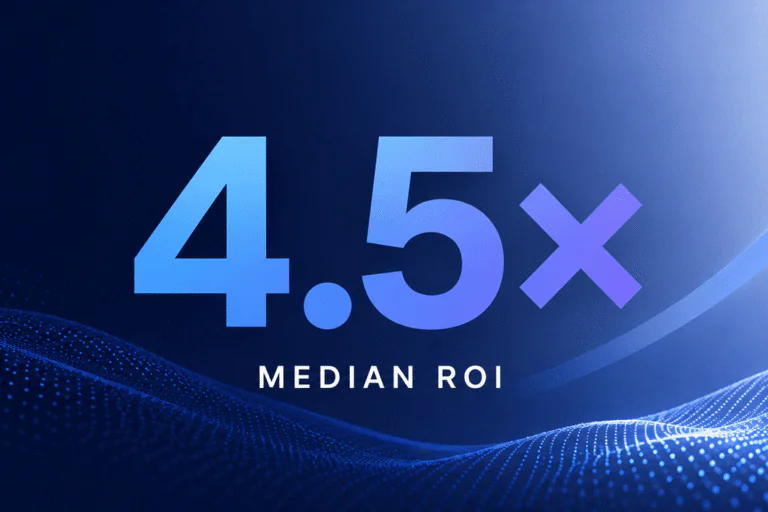
Seemore Data customers see a median ROI of 4.5×. The average across our customer base is 6×, and our best performing customer reached 32×.
We lead with the median, not the average. Here’s why, and here’s the full distribution behind both numbers.
What we mean by ROI
Every vendor defines ROI differently, so here’s ours, precisely:
ROI = [total data platform cost savings delivered] ÷ [what the customer pays SeemoreData]
A 4.5× ROI means that for every $1 a customer spends on SeemoreData, they save $4.50 in Snowflake costs.
How we measure savings
This is where most cost optimization numbers fall apart, so we’ll be specific.
The naive approach is to compare spend before deployment against spend after. It’s simple, and it’s wrong in both directions. If a customer’s workloads grow after deployment, a real saving shows up as flat or rising spend and gets undercounted. If workloads shrink for unrelated reasons, we’d claim credit for savings we didn’t produce.
So we don’t measure the change in spend. We measure the gap against a simulated baseline.
For each customer we model their pre-deployment behavior (warehouse sizing, run patterns, idle time, scaling decisions) and then simulate what that unchanged behavior would have cost while carrying their actual observed workload growth forward. That simulated figure is the counterfactual: the bill they would have received had nothing changed.
Savings are the difference between that simulated baseline and what they actually paid.
The key property is that workload growth appears on both sides of the comparison. A customer who doubles their data volume and holds spend flat has generated substantial savings, and this method captures that. A customer whose spend drops because their business slowed down has not, and this method doesn’t credit us for it.
This is a modeled counterfactual, not a controlled experiment, the honest limitation of any optimization measurement, since you can’t run a customer’s production platform both ways simultaneously. What we can do is hold the simulation to the customer’s own historical behavior rather than an assumption, and show them the model.
Why the median, not the average
Averages are easy to inflate. One exceptional result pulls the whole number up, and the figure you publish stops describing anyone real.
Ours is a live example. Our top customer hit 32× ROI and that single account contributes roughly a quarter of our total combined ROI. It’s a genuine result, and it lifts our average to 6×. But no prospective customer should plan around it.
The median is the number in the middle. half our customers land above it, half below. It can’t be dragged upward by one outlier, which makes it the honest answer to the question most buyers are actually asking- what is this likely to do for me?
That answer is 4.5×.
The full distribution
| ROI band | Share of customers |
| 8× or higher | 23% |
| 3-7× | 50% |
| 1-2× | 27% |
Reading across the distribution:
- Half of SeemoreData customers achieve 5× ROI or better.
- More than 40% exceed 7×.
- No customer is net negative. Even the lowest-performing band returns 1-2×, meaning every customer in our base saves more than they spend with us.
That last point matters more to us than the ceiling. A high top end number tells you what’s possible under ideal conditions. The floor tells you what happens when conditions are ordinary, and ordinary is what most deployments look like.
Methodology at a glance
- Population: all customers active as of August 15th 2026
- Measurement period: January 1st 2026 to date
- Baseline: each customer’s own pre feature deployment behavior, simulated forward with observed workload growth
- Platform: Snowflake
- Cost basis: actual credit consumption at the customer’s contracted rate
Where the savings come from
SeemoreData reduces data platform spend through [Smart Pulse warehouse sizing, Auto Shutdown, Auto Scaler — 1–2 sentences on the mechanism]. The ROI figures above reflect realized savings from these automations, not modeled or projected savings.
Frequently asked
Is 4.5× typical for a new customer? Yes it’s the middle of our existing base, and that base runs from Fortune 2000 enterprises down to considerably smaller businesses. The strongest predictor of where a customer lands isn’t company size it’s how quickly the team adopts the resource automation. Across every size band we’ve measured, savings have never come in below 21% of total Snowflake contract spend on the accounts we’re connected to.
How long until a customer reaches this? Most customers cross 1× ROI, the break even point, where savings cover what they pay us, during the POC itself or shortly after, depending on how fast the automations are adopted. Returns build from there as more of the platform comes under management.
Can I see what this would look like in my environment? Yes. Get in touch and we’ll model it against your actual workloads.