Why Your Snowflake Bill Doubled – And Your Team Had No Idea


There’s a post on r/dataengineering that got thousands of upvotes last month. A junior engineer changed one Snowflake setting, cut the company’s compute bill in half, and didn’t tell anyone for weeks – because they weren’t sure if the setting had been configured that way on purpose.
It wasn’t. It was just the default.
That story isn’t an outlier. It’s the norm. Most Snowflake cost increase isn’t caused by explosive growth or reckless usage. They’re caused by misconfigured defaults, invisible idle compute, and a complete absence of cost visibility at the query and pipeline level.
This article covers the 6 most common root causes, how to detect each one, and what to do before the next bill lands.
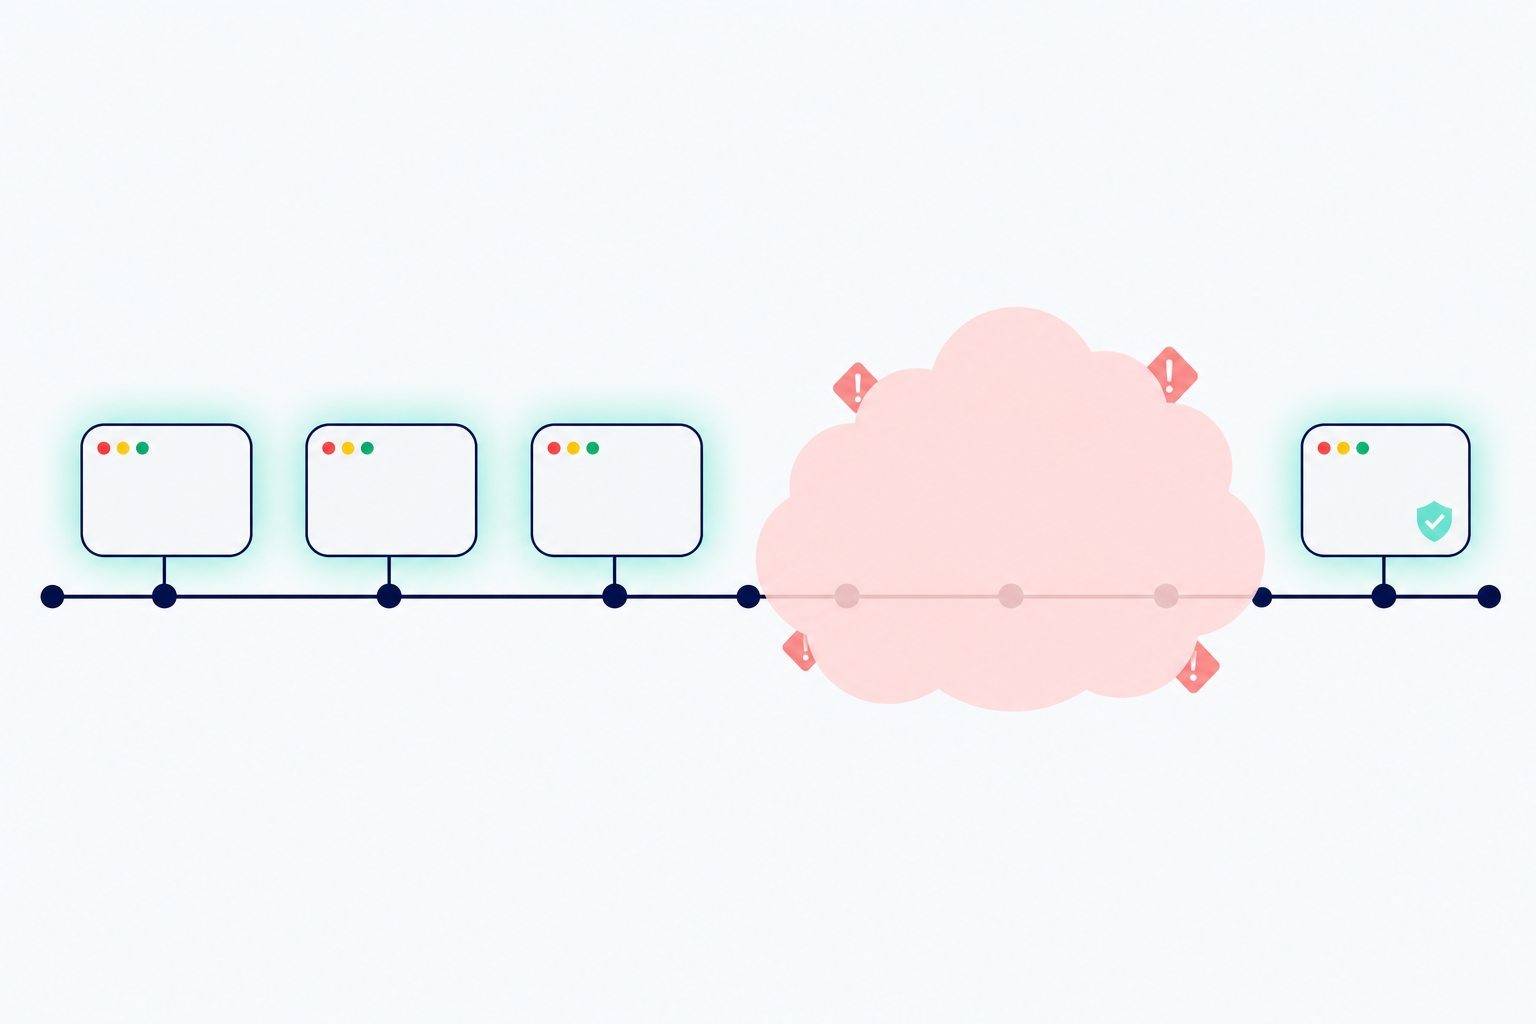
Table of Contents
- TL;DR
- The 6 Most Common Reasons Your Snowflake Bill Spiked
- Root Cause 1: Misconfigured Auto-Suspend
- Root Cause 2: Over-Provisioned Warehouse Size
- Root Cause 3: Runaway Long-Running Queries
- Root Cause 4: Duplicate Pipeline Runs
- Root Cause 5: Shadow BI Refreshes
- Root Cause 6: Missing Cost Attribution
- The Real Problem: Snowflake Doesn’t Hide Your Costs – Your Tooling Does
- FAQ
TL;DR
- Snowflake charges for compute time – idle time included
- The default auto-suspend setting (10 minutes) is one of the most common sources of silent waste
- Most teams discover cost problems from a bill, not from monitoring
- Runaway queries, over-provisioned warehouses, and duplicate pipeline runs compound quietly
- Traditional monitoring tools tell you a pipeline succeeded – not what it cost to run
- Seemore surfaces cost anomalies at the query and pipeline level before they reach your invoice

The 6 Most Common Reasons Your Snowflake Cost Increase
| Root Cause | How It Happens | Typical Cost Impact | How to Detect | Prevention |
| Misconfigured auto-suspend | Default set to 10 min; warehouse idles between queries | High – can double compute costs | Check warehouse settings in Snowsight | Set to 1–2 min for non-interactive warehouses |
| Over-provisioned warehouse size | XL used where M would suffice | High warehouse size multiplies the credit burn rate | Compare utilization % vs. credits consumed | Right-size based on query spill and queue metrics |
| Runaway long-running queries | A single unoptimized query scans terabytes | Very high – one query can spike a daily budget | QUERY_HISTORY filtered by execution_time | Set query timeout limits per warehouse |
| Duplicate pipeline runs | Race condition or manual re-trigger runs a job twice | Medium – doubles compute for every affected run | Cross-reference QUERY_HISTORY with job scheduler logs | Idempotency checks and job-level locking |
| Shadow BI refreshes | Dashboard auto-refreshes on a schedule no one uses | Medium – steady low-level drain | Filter QUERY_HISTORY by query tag/source | Audit BI tool schedules, disable unused dashboards |
| Missing cost attribution | No tagging by team or pipeline – waste is invisible | Indirect – prevents the diagnosis of all other causes | No warehouse or query tags in QUERY_HISTORY | Tag every warehouse and pipeline at creation |
Root Cause 1: Misconfigured Auto-Suspend
What it is
Snowflake warehouses stay active until they’ve been idle for a configurable period. The default is 10 minutes. That means every time a query finishes, your warehouse keeps burning credits for up to 10 more minutes waiting for the next one.
For a team running sporadic queries throughout the day, that idle time adds up fast.
How it inflates your bill
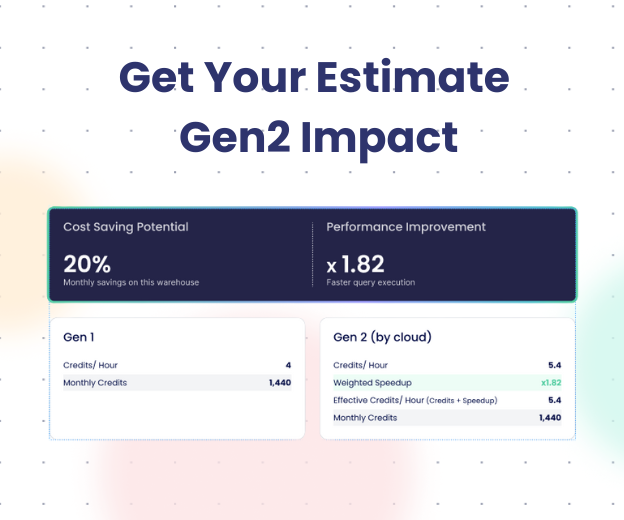
An X-Large warehouse costs 16 credits per hour. At 10 minutes of idle time per query, and 30 queries spread across an 8-hour workday, you’re paying for roughly 5 hours of compute that did nothing. At $3 per credit, that’s $240/day in pure waste – from one warehouse, due to one misconfigured setting.
Detection check
Go to Admin → Warehouses in Snowsight. Check the Auto Suspend column for each warehouse. Any value above 2 minutes on a non-interactive warehouse is worth reviewing.
Or run:
SELECT warehouse_name, auto_suspend
FROM snowflake.account_usage.warehouses
WHERE auto_suspend > 120
ORDER BY auto_suspend DESC;
Warning sign teams miss
The warehouse looks “in use” because utilization shows up when queries run – not during the idle gaps. Utilization dashboards don’t show you what you paid for silence.
Root Cause 2: Over-Provisioned Warehouse Size
What it is
Warehouse size in Snowflake determines credit burn rate. An XL warehouse costs 8x more per hour than a Small. Most teams provision large warehouses during initial setup and never revisit them – especially when the workloads that justified the size have since changed.
How it inflates your bill
If your XL warehouse is running queries that a Medium could handle (no spillage to disk, no queuing, sub-30-second execution), you’re paying 4x too much for every credit consumed. The work gets done – it just costs 4x more than necessary.
Detection check
SELECT
warehouse_name,
AVG(bytes_spilled_to_local_storage) as avg_spill,
AVG(queued_overload_time) as avg_queue_time,
COUNT(*) as query_count
FROM snowflake.account_usage.query_history
WHERE start_time >= DATEADD(day, -30, CURRENT_TIMESTAMP)
GROUP BY warehouse_name
ORDER BY avg_spill ASC;
Low spill and near-zero queue time on a large warehouse = you’re over-provisioned.
Warning sign teams miss
Queries finishing fast feel like a success. Nobody reports a problem when performance is good. The cost of that performance is invisible until the bill arrives.
Root Cause 3: Runaway Long-Running Queries
What it is
A single poorly-written query – a full table scan, a missing join filter, a Cartesian product – can consume an entire warehouse’s compute for hours. Snowflake’s default query timeout is 48 hours. A query that runs for 4 hours on an XL warehouse costs 64 credits. At $3/credit, that’s $192 from one query.
How it inflates your bill
Unlike a bad configuration that drains steadily, runaway queries spike your usage sharply and unpredictably. They often trigger warehouse auto-scaling (spinning up additional clusters), which compounds the cost further.
Detection check
SELECT
query_id,
query_text,
warehouse_name,
warehouse_size,
execution_time / 60000 as execution_minutes,
credits_used_cloud_services
FROM snowflake.account_usage.query_history
WHERE execution_time > 3600000 – – longer than 60 minutes
AND start_time >= DATEADD(day, -7, CURRENT_TIMESTAMP)
ORDER BY execution_time DESC;
Warning sign teams miss
Snowflake doesn’t alert on expensive queries by default. The query runs, completes (or times out after 48 hours), and the cost appears in your account usage a day later. By then, the engineer who ran it had moved on.
Root Cause 4: Duplicate Pipeline Runs
What it is
A pipeline job runs twice – triggered once by a scheduler and once manually after someone assumed it hadn’t started. Or a race condition causes two parallel executions. The data produced may be identical (or deduped downstream), but the compute cost is paid twice.
How it inflates your bill
For heavy transformation pipelines on large warehouses, a duplicate run doubles the compute for that job. If this happens daily or on high-frequency pipelines, it compounds into a meaningful monthly cost.
Detection check
Look for identical query fingerprints running in close time windows:
SELECT
query_hash,
COUNT(*) as run_count,
MIN(start_time) as first_run,
MAX(start_time) as last_run,
DATEDIFF(minute, MIN(start_time), MAX(start_time)) as minutes_apart
FROM snowflake.account_usage.query_history
WHERE start_time >= DATEADD(day, -7, CURRENT_TIMESTAMP)
GROUP BY query_hash
HAVING COUNT(*) > 1 AND minutes_apart < 30
ORDER BY run_count DESC;
Warning sign teams miss
Downstream data looks correct (deduplication handles it), so nobody flags the pipeline as having run twice. The cost anomaly is invisible at the data layer.
Root Cause 5: Shadow BI Refreshes
What it is
BI tools like Tableau, Looker, and Power BI auto-refresh dashboards on a schedule. When a dashboard is no longer actively used, or when the underlying data doesn’t change frequently, those refreshes continue to fire, querying your warehouse on a cadence nobody asked for.
How it inflates your bill
A dashboard refreshing every 15 minutes, 24 hours a day, runs 96 queries per day. In a dedicated warehouse, that’s 96 cold-start cycles (or 96 idle-time extensions if auto-suspend is too high). Multiply across 20 dashboards that nobody checks, and it adds up.
Detection check
Filter QUERY_HISTORY by the BI tool’s query tag or user agent:
SELECT
query_tag,
COUNT(*) as query_count,
SUM(execution_time) / 3600000 as total_hours,
MIN(start_time) as first_seen,
MAX(start_time) as last_seen
FROM snowflake.account_usage.query_history
WHERE query_tag ILIKE ‘%tableau%’
OR query_tag ILIKE ‘%looker%’
OR query_tag ILIKE ‘%powerbi%’
GROUP BY query_tag
ORDER BY query_count DESC;
Cross-reference with actual dashboard view counts in your BI tool’s usage logs.
Warning sign teams miss
BI refresh schedules are set by analysts and never revisited. The DE team rarely has visibility into what’s being refreshed or how often – because they don’t own the BI layer.
Root Cause 6: Missing Cost Attribution
What it is
This one isn’t a direct cost driver – it’s the reason the other five go undetected for so long. When warehouses and queries aren’t tagged by team, pipeline, or data product, there’s no way to trace a billing spike back to a cause.
How it inflates your bill (indirectly)
Cost problems that can’t be attributed to a responsible owner don’t get fixed. The absence of tagging turns every billing investigation into a manual forensic exercise – and most Snowflake cost management tools can’t help if there’s nothing to attribute costs to.
Detection check
SELECT
COUNT(*) as untagged_queries,
SUM(execution_time) / 3600000 as untagged_hours
FROM snowflake.account_usage.query_history
WHERE (query_tag IS NULL OR query_tag = ”)
AND start_time >= DATEADD(day, -30, CURRENT_TIMESTAMP);
If this number is large, you have a blind spot.
Warning sign teams miss
“We’ll add tagging later” becomes never. By the time the team is big enough to need attribution, fixing the tagging gap requires retrofitting every pipeline and warehouse.
The Real Problem: Snowflake Doesn’t Hide Your Costs – Your Tooling Does
Snowflake exposes everything. QUERY_HISTORY, WAREHOUSE_METERING_HISTORY, ACCESS_HISTORY – the data is all there. The problem is that nobody is watching it continuously.
Your pipeline monitoring tools tell you a pipeline succeeded. They don’t tell you it consumed 3x more credits than it did last week. They don’t flag when a new query pattern is burning through your daily credit budget before noon. They don’t alert when auto-suspend is set to 10 minutes on a warehouse that runs 5 queries a day.
That’s the gap.
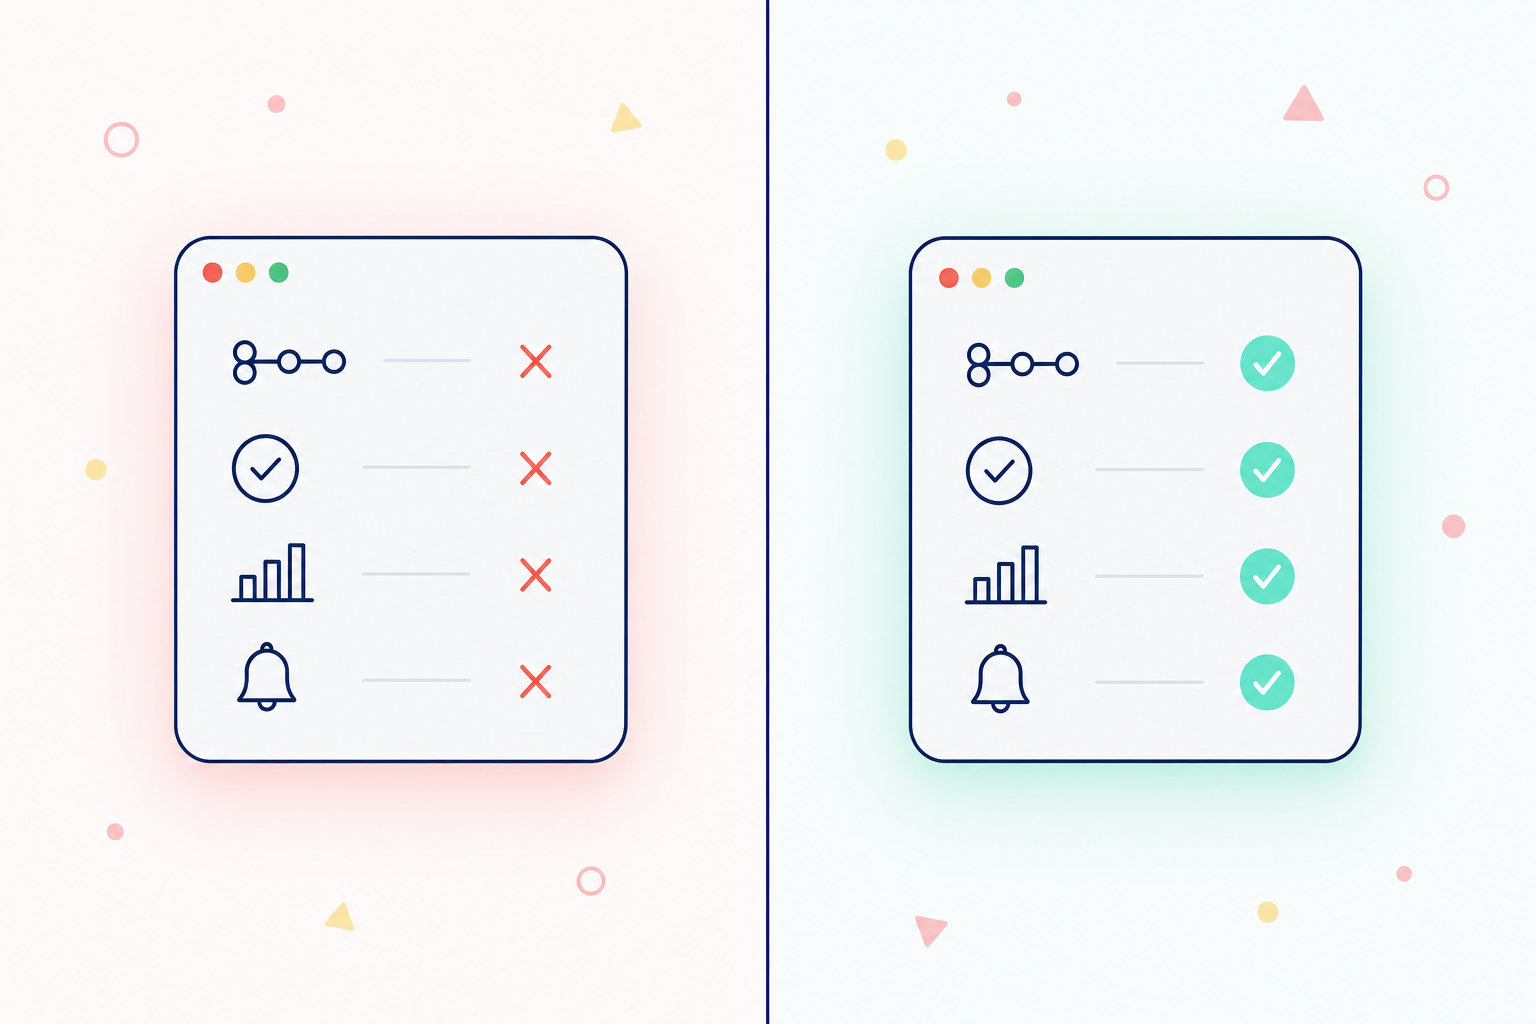
Seemore continuously monitors your Snowflake environment, baselining costs by warehouse, query fingerprint, pipeline, and team. When a pattern starts costing more than its baseline, you get an alert before it appears on your invoice.
The difference between discovering a cost problem from a bill vs. discovering it from an alert is the difference between paying for the damage and preventing it.
FAQ
Why did my Snowflake bill increase suddenly?
The most common causes are misconfigured auto-suspend settings (Snowflake’s default is 10 minutes of idle time), a runaway long-running query, an over-provisioned warehouse size, or duplicate pipeline runs. Start by querying WAREHOUSE_METERING_HISTORY and QUERY_HISTORY for the billing period in question to isolate which warehouse and which queries drove the spike.
How do I reduce Snowflake costs without impacting performance?
Start with auto-suspend: set it to 1–2 minutes for batch and ETL warehouses, and 5 minutes for interactive/BI warehouses. Then right-size warehouses based on spill and queue metrics – not on query speed alone. Finally, set a query timeout per warehouse to prevent runaway queries from consuming hours of credits. These three changes typically reduce compute costs by 20–40% with minimal performance impact.
What is the default Snowflake auto-suspend setting, and should I change it?
The default is 10 minutes. For most batch and ETL workloads, this is too high – Snowflake warehouse startup time is under 1 second, so there’s almost no performance cost to suspending aggressively. Set batch warehouses to 60 seconds and monitor for any increase in cold-start complaints.
How do I find which queries are costing the most in Snowflake?
Query the SNOWFLAKE.ACCOUNT_USAGE.QUERY_HISTORY view, filtering by EXECUTION_TIME and joining against WAREHOUSE_METERING_HISTORY to calculate approximate credit cost per query. Sort by execution time descending and look for outliers – queries running 10x longer than the median for that warehouse are your first targets.