TL;DR
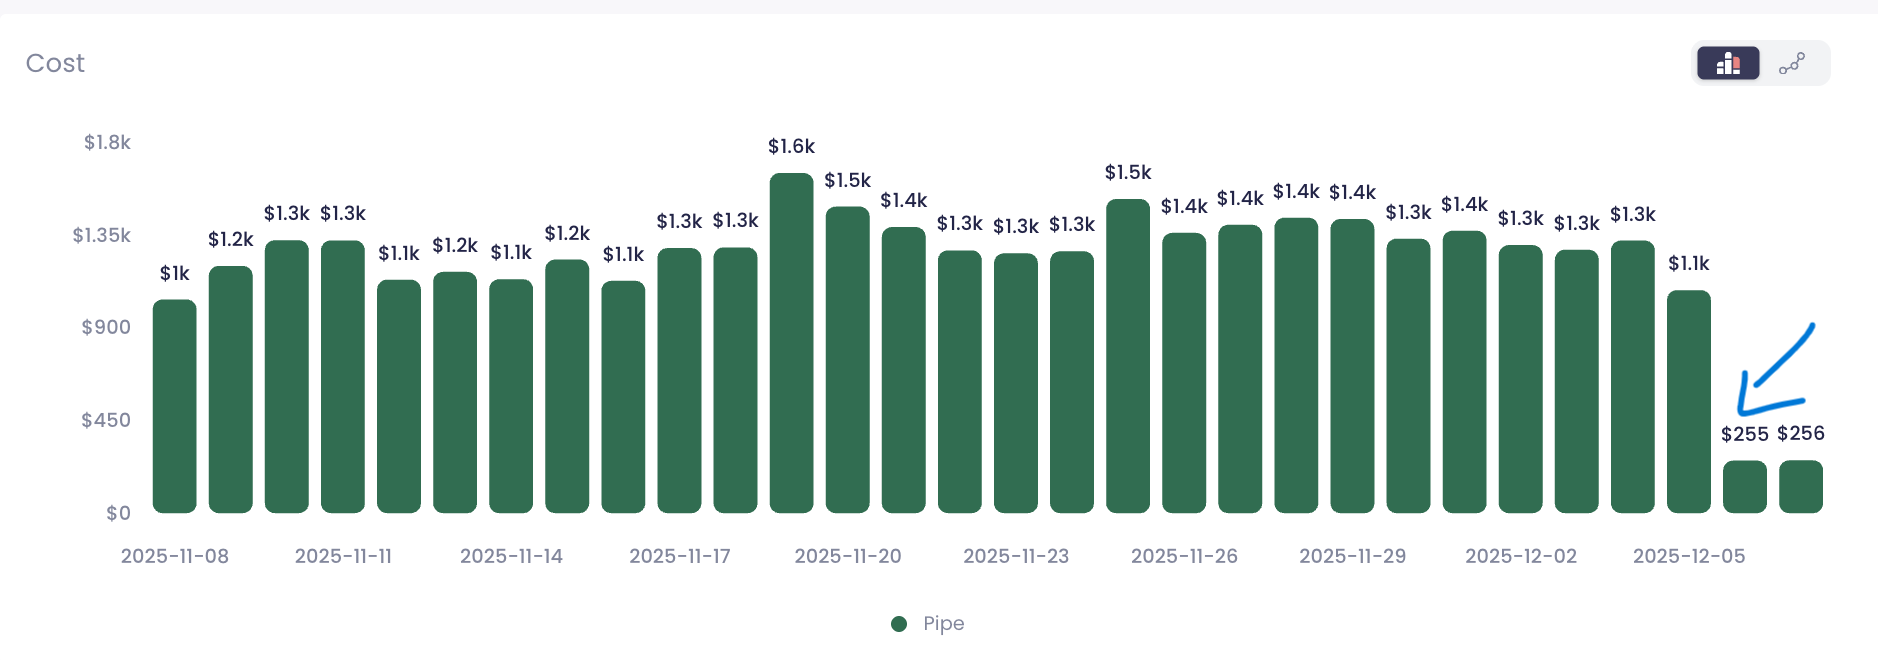
Snowflake’s new Snowpipe pricing model has quietly transformed ingestion economics. Across SeemoreData customer environments, we’ve measured 80–95% reductions in daily Snowpipe spend – without changing pipelines, ingestion volume, or file patterns. One chart recently made everyone stop scrolling: a clean wall of daily Snowpipe costs around $1.3k–$1.6k… followed by a sudden cliff down to ~$250.
Same data volume. Same workloads. No tuning.
Just Snowflake’s new Snowpipe pricing model kicking in.
In this post I’ll walk through:
- What Snowflake changed
- How to query your own Snowpipe usage
- How to confirm the “0.0037 credits per GB” rate
- How to measure your own savings
- How to estimate cost for new ingestion workloads
1. What changed in Snowpipe pricing?
Previously, Snowpipe was billed based on:
- Serverless compute to load data (per-second, per-core)
- Plus a fee per 1,000 files loaded
If you were ingesting lots of small files, this could get painful and unpredictable.
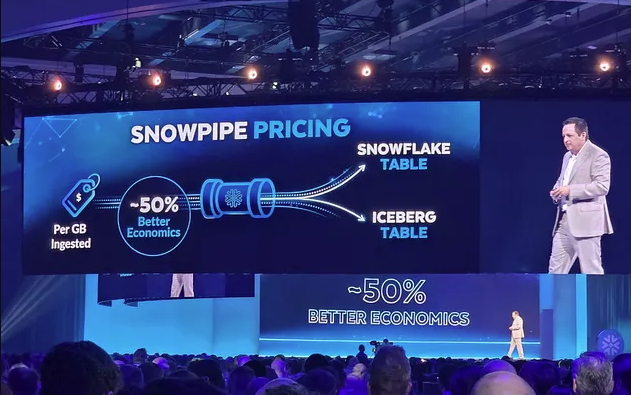
Snowflake shifted Snowpipe to a simple per-GB pricing model:
- You’re charged a fixed 0.0037 credits per GB of data ingested with Snowpipe
- Text formats are billed on uncompressed size; binary formats on observed size
In other words:
credits = GB_ingested * 0.0037
$ cost = credits * $ per credit
That’s it. No more thinking in terms of cluster-seconds and file counts.
The new Snowpipe pricing rollout hit VPS and Business Critical first, then Standard and Enterprise. As soon as pricing flipped, our dashboards showed a dramatic drop — often from $1.3k–$1.6k/day down to ~$250/day for the exact same workload.
Learn more about Snowpipe here >>
2. Where Snowpipe cost data lives
All of the cost analysis below uses the view:
SNOWFLAKE.ACCOUNT_USAGE.PIPE_USAGE_HISTORY
This view exposes historical usage per Snowpipe. Key columns:
- START_TIME – timestamp of a usage record
- PIPE_NAME – fully qualified pipe name
- CREDITS_USED – credits consumed
- BYTES_BILLED (or similar) – bytes that were actually billed under the per-GB model
We’ll join that with your own credit price to turn credits into dollars.

3. Daily Snowpipe cost per pipe (credits & dollars)
First, let’s recreate the kind of chart I mentioned: daily cost per pipe over the last 30 days.
Assumptions:
- Your Snowflake credit price is $4.00 per credit (replace with your real number).
— Replace 4.00 with your actual price per credit
SET credit_price_usd = 4.00;
SELECT
TO_DATE(start_time) AS usage_date,
pipe_name,
SUM(credits_used) AS credits_used,
SUM(bytes_billed) / POWER(1024, 3) AS gb_billed,
ROUND(SUM(credits_used) * $credit_price_usd, 2) AS usd_cost_estimate
FROM snowflake.account_usage.pipe_usage_history
WHERE start_time >= DATEADD(day, -30, CURRENT_TIMESTAMP())
GROUP BY 1, 2
ORDER BY usage_date, pipe_name;
How to use this
- Feed the result into your BI tool (or even a quick Snowsight chart)
- Plot usage_date on the X-axis and usd_cost_estimate as a bar
- Group or color by pipe_name if you want to compare pipes
If you were already using Snowpipe before the new model kicked in, you’ll likely see a clear step down in cost once your account switched.
Zooming into a single pipe
To explain the change to your team or to a customer, it’s helpful to pick one noisy, high-volume pipe and show its before/after curve.
SET credit_price_usd = 4.00;
WITH daily_cost AS (
SELECT
TO_DATE(start_time) AS usage_date,
SUM(credits_used) AS credits_used,
SUM(bytes_billed) / POWER(1024, 3) AS gb_billed
FROM snowflake.account_usage.pipe_usage_history
WHERE pipe_name = ‘MY_DB.MY_SCHEMA.MY_PIPE’ — change this
AND start_time >= ‘2025-11-01’::TIMESTAMP — adjust range
GROUP BY 1
)
SELECT
usage_date,
credits_used,
gb_billed,
ROUND(credits_used * $credit_price_usd, 2) AS usd_cost_estimate
FROM daily_cost
ORDER BY usage_date;
Plot this as a time series. The shape tells the story better than any blog post:
- Before rollout: noisy but high plateau ($1k+ per day)
- After rollout: same GB, but a much lower, flatter line
Proving the “0.0037 credits per GB” from your own data
If you want to double-check Snowflake’s math, you can compute the effective credits per GB across your pipes.
SELECT
pipe_name,
SUM(bytes_billed) / POWER(1024, 3) AS total_gb_billed,
SUM(credits_used) AS total_credits,
SUM(credits_used) / NULLIF(SUM(bytes_billed) / POWER(1024, 3), 0) AS credits_per_gb
FROM snowflake.account_usage.pipe_usage_history
WHERE start_time >= ‘2025-12-05’::TIMESTAMP — date new pricing applied in your acct
GROUP BY pipe_name
ORDER BY total_gb_billed DESC;
For recent dates, the credits_per_gb column should cluster around 0.0037, matching the official Snowflake documentation.
This is a great sanity check and a nice slide for internal reviews.
Measuring savings: before vs. after
Now for the fun part: quantifying the 80–95% drop.
Let’s compare average daily cost in a “before” window and an “after” window around the rollout date.
SET credit_price_usd = 4.00;
WITH before_period AS (
SELECT
AVG(daily_credits) AS avg_daily_credits_before
FROM (
SELECT
TO_DATE(start_time) AS usage_date,
SUM(credits_used) AS daily_credits
FROM snowflake.account_usage.pipe_usage_history
WHERE start_time BETWEEN ‘2025-11-08’::TIMESTAMP — adjust to your dates
AND ‘2025-12-04’::TIMESTAMP
GROUP BY 1
)
),
after_period AS (
SELECT
AVG(daily_credits) AS avg_daily_credits_after
FROM (
SELECT
TO_DATE(start_time) AS usage_date,
SUM(credits_used) AS daily_credits
FROM snowflake.account_usage.pipe_usage_history
WHERE start_time BETWEEN ‘2025-12-05’::TIMESTAMP
AND ‘2025-12-07’::TIMESTAMP
GROUP BY 1
)
)
SELECT
avg_daily_credits_before,
avg_daily_credits_after,
ROUND(
1 – (avg_daily_credits_after / NULLIF(avg_daily_credits_before, 0)),
3
) AS reduction_ratio,
ROUND(avg_daily_credits_before * $credit_price_usd, 2) AS avg_usd_before,
ROUND(avg_daily_credits_after * $credit_price_usd, 2) AS avg_usd_after;
reduction_ratio should be something like 0.80–0.95, i.e. 80–95% lower daily cost for the same workload.
4. Estimating Snowpipe cost for new workloads
The new model also makes forward planning much easier.
Say you expect to ingest 5 TB per day via Snowpipe and your price is still $4 per credit.
SET credit_price_usd = 4.00;
SELECT
5.0 * 1024 AS gb_per_day, — 5 TB
5.0 * 1024 * 0.0037 AS credits_per_day,
ROUND(5.0 * 1024 * 0.0037 * $credit_price_usd, 2) AS usd_per_day_estimate,
ROUND(5.0 * 1024 * 0.0037 * $credit_price_usd * 30, 2) AS usd_per_month_estimate;
No need to guess how many files, how many seconds a serverless warehouse will be “warm,” or what concurrency bursts will look like. You just model GB.
Final thoughts
Snowflake’s new Snowpipe pricing per-GB Snowpipe pricing is one of the biggest cost improvements we’ve seen in real customer environments. This pricing change wasn’t a small tweak; it completely reshaped the economics of continuous ingestion:
- Workloads with lots of small files benefited the most
- The per-GB model removed a lot of noise from the bill
- We now see 80–95% lower Snowpipe cost in multiple real environments, without changing a single pipeline
If you rely heavily on Snowpipe, it’s worth running these queries on your own account and building a simple dashboard. The picture of that cost cliff is one of the nicest screenshots you can send to your finance team.
And if you want automated Snowflake cost visibility, we’re here to help.