How to Reduce Snowflake Costs by 30% with Smarter Data Monitoring


Snowflake has revolutionized cloud data warehousing, but with its pay-per-use model comes a hidden challenge: costs can spiral out of control without proper monitoring. According to recent industry reports, many organizations discover they’re overspending on Snowflake by 30-50% due to inefficient resource usage, oversized warehouses, and lack of visibility into their data operations.
The good news? With smarter data monitoring, you can reclaim that lost budget and reduce Snowflake costs while boosting performance..
The Hidden Cost Drivers in Snowflake
Snowflake’s architecture separates compute from storage, which is powerful but requires vigilant monitoring.
Here’s where costs typically leak:
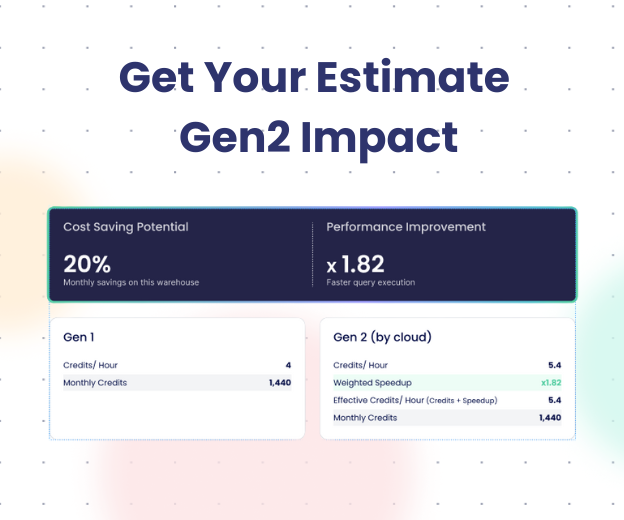
Warehouse Inefficiencies: Oversized virtual warehouses consume credits even when underutilized. Many teams default to Large or X-Large warehouses when Medium would suffice, burning through budgets unnecessarily.
Query Spillage: When warehouses lack sufficient memory, queries spill to local or remote storage. This not only slows performance but increases compute time and costs. According to Snowflake’s optimization documentation, spillage is one of the most overlooked cost drivers.
Storage Bloat: Time Travel and Fail-Safe features are valuable for recovery, but they double or triple storage costs when left at default settings on non-critical data. Medium articles by Snowflake practitioners highlight that staging and development tables often retain unnecessary data history.
Idle Resources: Warehouses that don’t auto-suspend or clusters that scale out unnecessarily drain credits during inactive periods.
The Traditional Approach: Manual Monitoring Falls Short
Most data teams start with Snowflake’s built-in cost management dashboards. While these provide basic visibility into credit consumption and top-spending warehouses, they fall short in several ways:
- Reactive, not proactive: You discover overruns after they’ve happened
- No context: High costs without understanding why or where to fix them
- Manual intervention required: Optimization requires constant analyst attention
- Limited lineage visibility: Can’t trace costs back through your data pipeline
Smarter Monitoring: The Path to 30% Savings
Modern cost optimization requires three pillars:
1. Real-Time Visibility with Context
Instead of just seeing which warehouse consumed the most credits, you need to understand:
- Which specific queries drove costs
- What data products or business units generated the spend
- How costs flow through your entire pipeline, from source to dashboard
Monitoring solutions should provide column-level lineage, showing not just what’s expensive but why it’s expensive and what downstream assets depend on it.
2. Automated Right-Sizing
Manual warehouse sizing is guesswork. Advanced monitoring platforms use AI to:
- Analyze actual query patterns and resource consumption
- Automatically recommend optimal warehouse sizes
- Detect spillage before it impacts performance
- Scale warehouses dynamically based on workload
3. Proactive Anomaly Detection
The best monitoring catches problems before they drain your budget:
- Rogue queries consuming unexpected resources
- Users accidentally running expensive operations
- Inefficient data refreshes running more frequently than needed
- Tables growing unexpectedly due to poor partitioning
The Complete Solution: Seemore Data
Where alternatives focus on point solutions, Seemore Data delivers comprehensive, end-to-end data pipeline optimization that addresses all cost drivers simultaneously:
Continuous Cost Control: Real-time visibility into costs across your entire data stack, from source to BI, with AI-driven savings automation. Unlike tools that only monitor warehouses, Seemore tracks costs at every level—by domain, user, warehouse, job, and data product.
Autonomous Warehouse Optimization: AI-powered continuous management that right-sizes compute dynamically, prevents spillage, and eliminates inefficiencies without manual intervention. Seemore’s approach goes beyond scheduled checks—it adapts in real-time to workload changes.
Deep Lineage Visibility: Column-level lineage that traces costs through your entire pipeline, helping you understand not just what is expensive but why and what depends on it. This unique capability lets you optimize at the root cause, not just treat symptoms.
Usage-Based Pipeline Optimization: Monitor and eliminate overuse by aligning resources with actual demand. Seemore identifies unused tables, dormant dashboards, and redundant pipelines that other tools miss.
Proactive AI Agent: Detects anomalies instantly, investigates root causes, and delivers actionable insights—before inefficiencies impact your budget. The platform’s AI learns your environment and proactively suggests optimizations tailored to your specific usage patterns.
Real results speak volumes: Artlist reduced Snowflake costs by 30% in one month, while Verbit achieved a 70% cost reduction with complete visibility across their data operations.
Alternative Solutions: What’s Available
Several tools have emerged to help teams optimize Snowflake costs:
SELECT offers management with automatic savings recommendations. It’s popular among mid-sized organizations looking for comprehensive visibility.
Keebo uses AI-powered automation to dynamically manage compute resources, focusing on warehouse optimization. As discussed on Reddit’s Snowflake community, it’s effective for teams with predictable workload patterns.
Sundeck provides query optimization and cost tracking, particularly useful for engineering-focused teams that want granular control.
However, these solutions often address only one aspect of the cost problem, typically compute optimization—leaving storage, lineage, and pipeline efficiency unmonitored.
Quick Wins You Can Implement Today
While implementing comprehensive monitoring, start with these immediate actions:
- Audit Time Travel settings: Set data_retention_time_in_days = 0 for staging tables
- Enable auto-suspend: Configure warehouses to suspend after 60 seconds of inactivity
- Start small: Default to XS warehouses and scale up only when performance demands it
- Review refresh schedules: Switch unnecessary hourly refreshes to daily
- Identify unused assets: Query ACCESS_HISTORY to find tables and dashboards nobody uses
Conclusion
Reducing Snowflake costs by 30% isn’t about slashing features or compromising performance, it’s about smarter monitoring that gives you visibility, automation, and proactive insights. While manual optimization and point solutions can help, comprehensive platforms like Seemore Data deliver the deepest savings by optimizing your entire data pipeline continuously and autonomously.
The question isn’t whether you can afford optimization tools, it’s whether you can afford not to use them. With Snowflake costs often representing a significant portion of data infrastructure budgets, even a 30% reduction pays for monitoring solutions many times over.
Ready to see where your Snowflake costs are hiding? Start your free trial with Seemore Data and discover optimization opportunities across your entire data stack.