From Runtime to Spillage: Snowflake Performance Optimization Insights from Our CPO

This blog recaps a live talk by Yaniv Leven, Chief Product Officer at Seemore, delivered at the Snowflake User Group Meetup in NYC (March 2025).
“You’re not just paying for compute. You’re paying for the wrong assumptions.”
That’s how I opened my talk at the Snowflake User Group Meetup in New York this past March. I said it because too many teams try to fix performance issues by throwing more compute at the problem, without understanding what their workloads are actually doing inside the warehouse.
This talk wasn’t about shaving costs for the sake of finance. It was about showing teams how performance and cost are connected at a deeper level. memory pressure, query structure, scan patterns, and spillage. If you can see what’s happening under the hood, you can optimize both speed and spend with clarity.
What Actually Drives Snowflake Costs
Most teams think about cost in terms of warehouse size. But that’s just the surface. What really affects your bill is what happens inside your warehouse once queries start running.
Here are the five biggest factors I focused on:
- Warehouse size
More cores and memory bring more speed, but they also inflate cost with every second of runtime. - Query load percent
This measures how much of the warehouse’s compute is actually used. If it is low, you’re paying for idle capacity. If it is high, you might be creating spillage. - Query duration
Longer queries keep your warehouse alive longer. This is often where credit burn sneaks in. - Bytes scanned
The more data you scan, the more memory and compute you consume. Inefficient scans lead directly to spillage. - Spillage
When memory fills up, Snowflake starts pushing data to SSD or even remote storage. This slows down queries and magnifies cost.
Spillage: The Hidden Bottleneck
Spillage is one of those issues that doesn’t show up in your dashboard but wrecks performance and budget in the background.
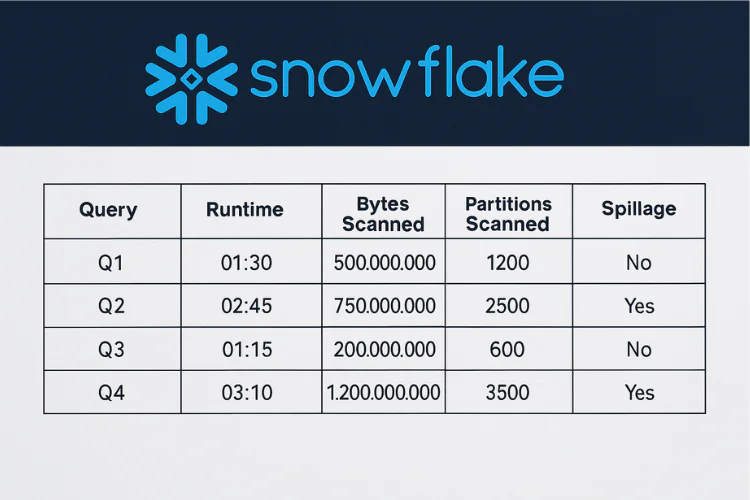
When a query overflows memory, it spills first to local SSD. If that fills up, it hits remote storage. At each stage, execution gets slower and more expensive. In our own benchmarks at Seemore, we’ve seen spillage increase runtime by 3x-9x
To check for spillage in your own environment, run:
sql
CopyEdit
SELECT query_id, user_name, spilled_to_local_storage, spilled_to_remote_storage
FROM SNOWFLAKE.ACCOUNT_USAGE.QUERY_HISTORY
WHERE start_time > DATEADD(DAY, -7, CURRENT_DATE())
AND (spilled_to_local_storage = ‘YES’ OR spilled_to_remote_storage = ‘YES’);
Spillage isn’t always bad. In some cases, it’s an integral part of the execution plan where the tradeoff would be much larger costs. That being said, it always means you could be getting better performance if you’re willing to pay more. How much better? That depends on the execution plan.
The Real Problem Isn’t Warehouse Size
Scaling up a warehouse is often the first move when performance lags. But in my experience, that move can easily backfire.
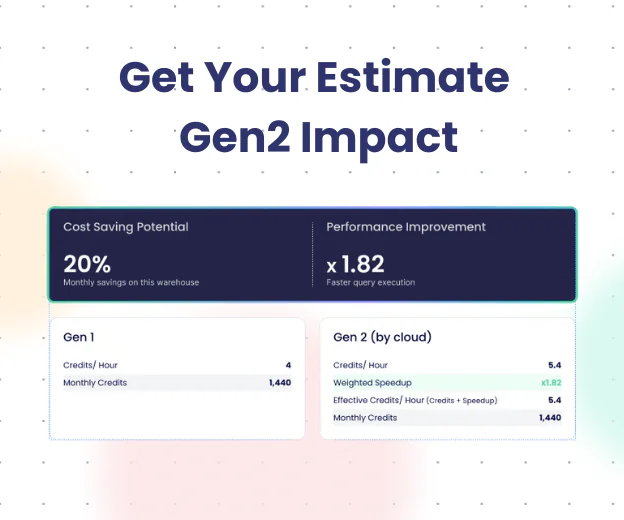
In multiple customer scenarios, I’ve seen teams move from Small to Medium or Medium to Large hoping for faster results. The result of scaling up often has no meaningful performance improvement but does come with a significant increase in compute cost. In many cases, the underlying query was written inefficiently or the warehouse was already oversized as is for the running workloads..
Before resizing, I recommend looking at the following parameters:
- What percent of compute is actually being used?
- Are queries spilling to SSD or HDD?
- Are you scanning more data than necessary?
If you can’t answer those questions clearly, scaling up is guesswork.
Reading Warehouse Runtime Like a Pro
One of the most useful tools I rely on is warehouse runtime distribution. It shows how long your queries actually take, which helps you determine if your warehouse is aligned with your workload.
Here’s how to generate your own snapshot:
sql
CopyEdit
SELECT DATE_TRUNC(‘HOUR’, start_time) AS hour,
COUNT(*) AS query_count,
AVG(execution_time) AS avg_runtime
FROM SNOWFLAKE.ACCOUNT_USAGE.QUERY_HISTORY
WHERE start_time >= DATEADD(DAY, -1, CURRENT_TIMESTAMP())
GROUP BY 1
ORDER BY 1;
Here are some sizing benchmarks:
- If the distribution is highly skewed for short queries (lets say 95% are in the seconds range) and you still have that 1% with spillage. You may as well divide these into 2 warehouses, one larger than current size (for the 5%) and another much smaller for the shorter queries.
- Any Query with remote spillage will run faster and cheaper on a larger warehouse. Always look at the top 1% in terms of runtime. In many cases you are keeping your warehouse size too large for a small number of queries.
- If you have short queries running hundreds or more times a day you need to dynamically schedule the warehouse size because it’s always up due to tiny queries.
Understanding runtime distribution is the fastest way I know to validate whether a warehouse is properly sized.
Bytes Scanned Is a Memory Problem
Scanning too much data isn’t just a performance problem. It’s a memory pressure problem. Every extra row scanned increases memory use. When memory fills up, queries spill, and costs go up.
Here’s how to reduce scan volume in practice:
- Avoid SELECT *. Only pull the columns you need.
- Filter early in your queries.
- Use clustering keys to help Snowflake scan only what matters.
Example:
sql
CopyEdit
ALTER TABLE orders CLUSTER BY (order_date);
Clustering like this helps Snowflake skip irrelevant partitions and dramatically reduce scan size.
Want to Automate This?
I closed the session with a reminder: most of these problems are fixable — but only if you can see them.
At Seemore, we built tools to give teams visibility into exactly these warehouse-level performance dynamics. With Seemore Data Cost Control and Warehouse Optimization, you can:
- Detect inefficient warehouses
- Identify which queries are spilling memory or driving up scan cost
- Surface your slowest, most expensive queries
- Get tuning recommendations based on real behavior
Snowflake is a powerful platform. But without visibility, it’s too easy to lose control of performance and cost. That’s where we can help.
If any of this resonates, let’s talk.